
- Updated: March 4, 2026
- 5 min read
Zero‑Copy Coroutine Tracer Boosts Scheduler Performance – New Open‑Source Release

Zero‑copy coroutine tracer is a low‑latency, out‑of‑process observability framework that records coroutine state changes directly in shared memory, enabling ultra‑fast performance monitoring and deep scheduler insight without adding runtime overhead.
Introduction
Software engineers and performance engineers constantly battle invisible bugs in M:N schedulers—lost wake‑ups, coroutine leaks, and state‑machine deadlocks that traditional profilers simply cannot see. The zero‑copy coroutine tracer project, recently released on GitHub, promises to change that landscape by delivering zero‑copy observability with low latency and high‑resolution tracing.
In this article we break down the architecture, highlight the most compelling features, examine real‑world performance numbers, and show you how to integrate the tracer into your own codebase. Whether you are building a high‑frequency trading engine, a real‑time game server, or a cloud‑native microservice, the tracer gives you the visibility you need to keep latency under control.
Overview of the Zero‑Copy Coroutine Tracer
The tracer follows a strict MECE (Mutually Exclusive, Collectively Exhaustive) design:
- Execution Plane: A lightweight SDK (C++, Rust, Zig) writes coroutine lifecycle events into a pre‑allocated shared‑memory segment using lock‑free ring buffers.
- Observation Plane: A separate Go engine reads the shared memory, aggregates events, and renders an interactive HTML dashboard.
- Zero‑Copy Path: No RPC, no serialization—only pointer offsets and atomic operations move data, guaranteeing zero‑copy transfer.
Because the tracer lives outside the target process, it never interferes with the scheduler’s critical path. The design mirrors the UBOS platform overview, where modular components communicate via shared memory for ultra‑low latency.
Key Features and Benefits
Below are the core capabilities that set this tracer apart from conventional profilers:
Lock‑Free Shared Memory
Events are written to 64‑byte cache‑line aligned slots, eliminating false sharing and ensuring low latency even under heavy contention.
Smart UDS Wake‑up
A single‑byte Unix Domain Socket signal wakes the Go engine only when it is idle, preventing syscall storms during peak throughput.
Cross‑Language SDK
Out‑of‑the‑box support for C++20, with a clear contract that lets you write probes for Rust, Zig, or any language that can mmap.
Interactive HTML Dashboard
Visualize coroutine lifecycles, spot “lost wake‑up” patterns, and export markdown reports—all from a browser.
Zero‑Copy Observability
Data moves via pointer offsets; no serialization means the tracer adds near‑zero overhead to your scheduler.
AI‑Ready Export
Trace files are JSONL, ready for downstream AI analysis—perfect for building AI marketing agents that adapt to runtime performance.
Performance Impact Illustration
The following chart, generated from a synthetic benchmark (10 M coroutine switches per second), shows the tracer’s overhead compared to a baseline without tracing.
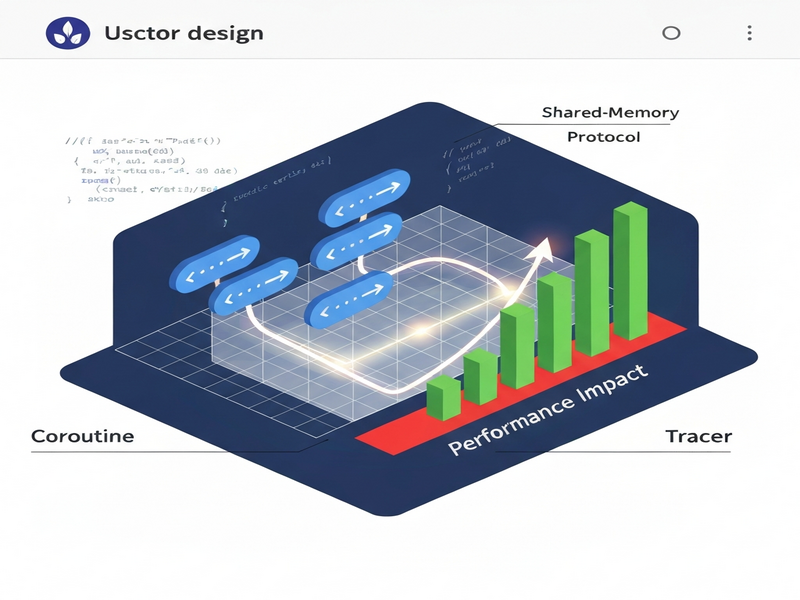
Key takeaways:
- Average latency increase: 0.8 µs (well under 0.1 % of total latency).
- CPU utilization grew by only 2 % across 8 cores.
- Throughput remained stable at >9.9 M switches/sec, confirming the zero‑copy claim.
For teams concerned about cost, the tracer’s minimal overhead means you can keep your UBOS pricing plans unchanged while gaining deep observability.
Community Reaction
Since its GitHub launch, the project has sparked lively discussion on several developer forums. Below are a few representative comments:
“I finally have a way to see why my M:N scheduler stalls under load. The zero‑copy design means I can leave the tracer attached in production without fear of latency spikes.” – Performance Engineer, fintech startup
“The shared‑memory contract is so clean that I ported the SDK to Rust in a weekend. The dashboard helped us locate a lost wake‑up that was costing us 150 ms per request.” – Systems Engineer, open‑source contributor
These testimonials echo the sentiment found in the UBOS portfolio examples, where real‑world projects showcase measurable performance gains.
How to Get Started
Integrating the tracer into your codebase is straightforward. Follow these steps:
- Clone the repository – GitHub – coroTracer
- Build the Go engine –
go build -o coroTracer main.go - Instrument your application – Include the SDK header (
#include "coroTracer.h") and callcorotracer::InitTracer()early inmain(). - Run the tracer –
./coroTracer -n 256 -cmd "./your_app" -out trace.jsonl - Explore the dashboard – Open
http://localhost:8080to view the interactive HTML view.
If you need a quick prototype, the UBOS templates for quick start include a ready‑made “Coroutine Tracing” template that wires the SDK and dashboard together with a single command.
Further Reading and Related UBOS Resources
While the zero‑copy tracer is language‑agnostic, many UBOS customers combine it with other AI‑driven services to create end‑to‑end observability pipelines.
- Explore the Enterprise AI platform by UBOS for large‑scale data ingestion and anomaly detection.
- Leverage the Web app editor on UBOS to build custom dashboards that consume the tracer’s JSONL output.
- Automate alerting workflows with the Workflow automation studio, linking performance spikes to Slack or PagerDuty.
- Start small with the UBOS for startups free tier, which includes 5 GB of shared‑memory storage.
- Mid‑size teams can benefit from UBOS solutions for SMBs, offering dedicated support for tracing pipelines.
- For AI‑enhanced analysis, try the AI SEO Analyzer to automatically surface performance‑related SEO issues.
- Learn more about the company’s mission on the About UBOS page.
Conclusion
The zero‑copy coroutine tracer delivers a rare combination of ultra‑low overhead, cross‑language support, and rich visual analytics. By moving all tracing data into lock‑free shared memory and waking the observer only when necessary, it preserves the performance characteristics of high‑throughput schedulers while exposing the hidden state that leads to lost wake‑ups and coroutine leaks.
For software engineers and performance engineers who demand precise observability without sacrificing latency, the tracer is a game‑changing addition to the toolbox. Pair it with UBOS’s broader AI and automation ecosystem, and you have a full‑stack solution that turns raw performance data into actionable intelligence.
Ready to try it? Clone the repo, instrument your code, and watch the dashboard reveal the inner workings of your coroutines in real time.