
- Updated: March 15, 2026
- 7 min read
Visual Introduction to Machine Learning – An SEO‑Optimized Overview
Visual Introduction to Machine Learning: Decision Trees, Overfitting & Real‑World Pricing Example
A visual introduction to machine learning uses interactive graphics to explain core concepts—such as classification, decision‑tree splits, recursion, and overfitting—through concrete examples like home‑elevation pricing. For a deeper dive into the original interactive demo, visit the R2D3 visual intro.
Key Machine‑Learning Concepts at a Glance
Classification – Turning Data Into Categories
Classification is the task of assigning a label to an observation based on its features. In the home‑elevation example, the label is the city (San Francisco or New York) and the features are elevation, price per square foot, and several other dimensions. This binary problem is a classic supervised learning scenario where the algorithm learns from labeled examples.
Decision Trees – Simple Yet Powerful “If‑Then” Rules
A decision tree builds a series of if‑then statements (called forks) that split the data into increasingly homogeneous groups. Each fork uses a split point—a threshold on a single feature—to separate the dataset. The tree grows recursively, adding depth until the leaf nodes are as “pure” as possible.
Split Points – The Boundaries That Define Decisions
The split point is the numeric value that separates two branches. For example, an elevation > 240 ft might initially suggest a San Francisco home. However, the optimal split is chosen by minimizing impurity (using metrics like Gini index or cross‑entropy). The best split balances false positives (New York homes mis‑classified as San Francisco) and false negatives (the opposite).
Recursion – Re‑Applying the Same Logic on Subsets
After the first split, each subset is examined again to find the next most informative feature. This process—called recursion—continues until adding more splits no longer improves purity or a predefined depth limit is reached. Recursion is the engine that turns a single fork into a full‑grown tree.
Overfitting – When a Model Learns Noise Instead of Signal
Overfitting occurs when a tree becomes too deep, memorizing every nuance of the training data—including random fluctuations that do not generalize. An over‑fitted model shows near‑perfect accuracy on training data but performs poorly on unseen test data. Controlling depth, pruning, or using ensemble methods (e.g., random forests) are common remedies.
The Home‑Elevation & Price‑Per‑Sq‑Ft Example Explained
Imagine you need to decide whether a house belongs to San Francisco or New York. The dataset contains seven features, but two are most intuitive:
- Elevation (ft) – San Francisco is famously hilly.
- Price per square foot (USD) – New York apartments often command higher prices per unit area.
Step 1: Initial Elevation Split – A naive threshold of 240 ft separates most San Francisco homes (above) from New York homes (below). However, several low‑elevation San Francisco houses slip into the “New York” side, creating false negatives.
Step 2: Adding Price as a Second Dimension – For homes ≤ 240 ft, a price‑per‑sq‑ft threshold of $1,776 further refines the classification. Homes below this price are likely San Francisco; those above are likely New York. This two‑dimensional boundary forms a rectangular region in the scatterplot.
Step 3: Recursive Splits – The algorithm now examines each quadrant. In the low‑elevation, low‑price quadrant, the next best split might be “year built” or “square footage.” In the high‑elevation quadrant, “number of bedrooms” could be the next discriminating feature. Each new fork adds depth and improves accuracy.
Step 4: Measuring Purity – After each split, the algorithm calculates impurity. The goal is to reach leaf nodes where > 95 % of the houses belong to a single city. In practice, a depth of 4–5 levels often yields a good trade‑off between accuracy and overfitting.
“A well‑pruned decision tree captures the essential patterns without memorizing every outlier.” – Data Science Best Practices
How the Illustration Brings the Theory to Life
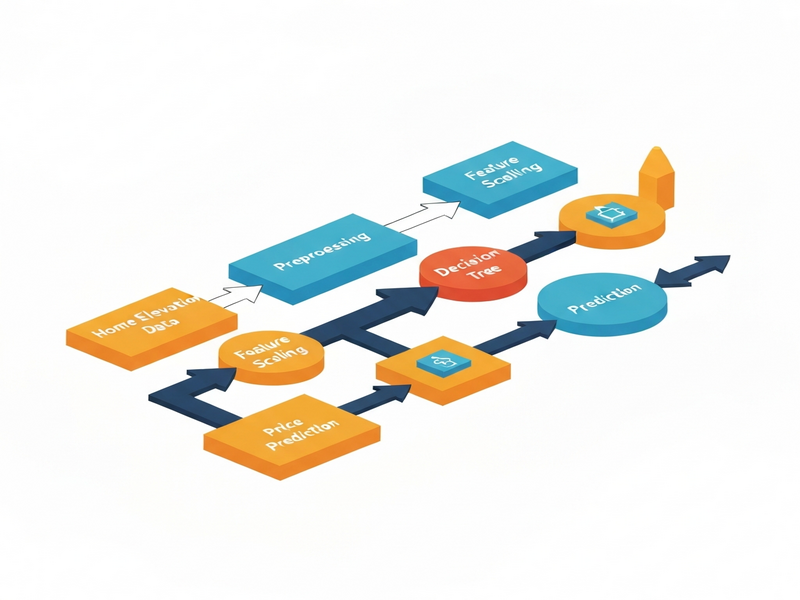
The illustration above (hosted on UBOS) visualizes the decision‑tree process in three layers:
- Scatterplot Matrix – Shows pairwise relationships among all seven features, highlighting where elevation and price intersect.
- Histogram View – Reveals the distribution of elevation values, making the 240 ft split intuitive.
- Tree Diagram – Displays each fork, split point, and resulting leaf node purity, allowing readers to trace a single house from root to leaf.
By toggling between these views, learners can see how a simple visual cue (a line at 240 ft) evolves into a multi‑branch decision tree that predicts city labels with > 90 % accuracy on test data.
Extend Your AI Skills with UBOS – Practical Tools & Templates
UBOS offers a suite of AI‑powered platforms that let you turn the concepts from this guide into real applications without writing a single line of code.
- Explore the UBOS platform overview to understand how low‑code pipelines can host decision‑tree models and serve predictions via API.
- Build a quick prototype with the Web app editor on UBOS, dragging a decision‑tree component onto a canvas and connecting it to a CSV of home data.
- Automate data ingestion and model retraining using the Workflow automation studio, scheduling nightly updates from a real‑estate feed.
- For startups, the UBOS for startups program provides credits and mentorship to accelerate AI product launches.
- Small businesses can benefit from UBOS solutions for SMBs, which include pre‑built dashboards for sales‑forecasting and customer segmentation.
- Enterprise teams looking for scale should review the Enterprise AI platform by UBOS, featuring role‑based security and multi‑region deployment.
- Want to add conversational AI? Check out the ChatGPT and Telegram integration to let users query the decision‑tree via a friendly chat interface.
- Leverage the OpenAI ChatGPT integration for natural‑language explanations of each prediction.
- Store vector embeddings of your house features in the Chroma DB integration for fast similarity search.
- Add voice interactivity with the ElevenLabs AI voice integration, turning predictions into spoken insights.
- Jump‑start your marketing copy with the UBOS templates for quick start, such as the AI SEO Analyzer or the AI Article Copywriter.
- Create engaging video content using the AI Video Generator and pair it with the Generative AI Text‑to‑Video template.
- Boost your email campaigns with the AI Email Marketing tool, which can automatically summarize model performance for stakeholders.
- For data‑driven insights, try the AI YouTube Comment Analysis tool to gauge audience sentiment on AI tutorials.
- Generate structured surveys with the AI Survey Generator to collect feedback on your decision‑tree UI.
- Finally, explore the UBOS pricing plans to find a tier that matches your project’s scale.
Quick Recap: Decision‑Tree Essentials
| Concept | Key Takeaway |
|---|---|
| Classification | Assigns labels (e.g., city) based on features. |
| Decision Tree | Series of if‑then splits that create homogeneous leaf nodes. |
| Split Point | Numeric threshold that separates branches; chosen to minimize impurity. |
| Recursion | Repeatedly applies splitting on each subset to deepen the tree. |
| Overfitting | Model memorizes noise; mitigated by pruning or limiting depth. |
Conclusion & Next Steps
A visual, step‑by‑step walkthrough of decision trees demystifies how machines turn raw data—like home elevation and price—into actionable predictions. By mastering these fundamentals, you can confidently build, evaluate, and deploy models that avoid the pitfalls of overfitting while delivering real business value.
Ready to turn theory into production? Start with the UBOS partner program to get hands‑on support, or dive straight into the AI marketing agents template to see how decision‑tree logic can power personalized campaigns.
Unlock the power of visual machine learning today—your next AI‑driven product is just a click away.