
- Updated: February 14, 2026
- 6 min read
Interactive Gamma Function Visualization Tool – Explore Complex Arguments in Real Time
The Gamma Function interactive visualization tool on UBOS lets users explore the complex Euler Gamma function in real time, adjusting both real and imaginary arguments while instantly seeing the impact on the function’s real and imaginary components.
Introduction: Visualizing a Classic Mathematical Beast
For over a century the Gamma function Γ(z) has been a cornerstone of complex analysis, probability theory, and quantum physics. Yet, its behavior over the complex plane remains abstract for many learners. UBOS’s new Gamma Function interactive visualization tool bridges that gap by turning equations into an animated, manipulable graph that reacts to every parameter change. This article explains what the tool does, why it matters to researchers and educators, and how you can start using it today.
Overview of the Gamma Function Visualization Tool
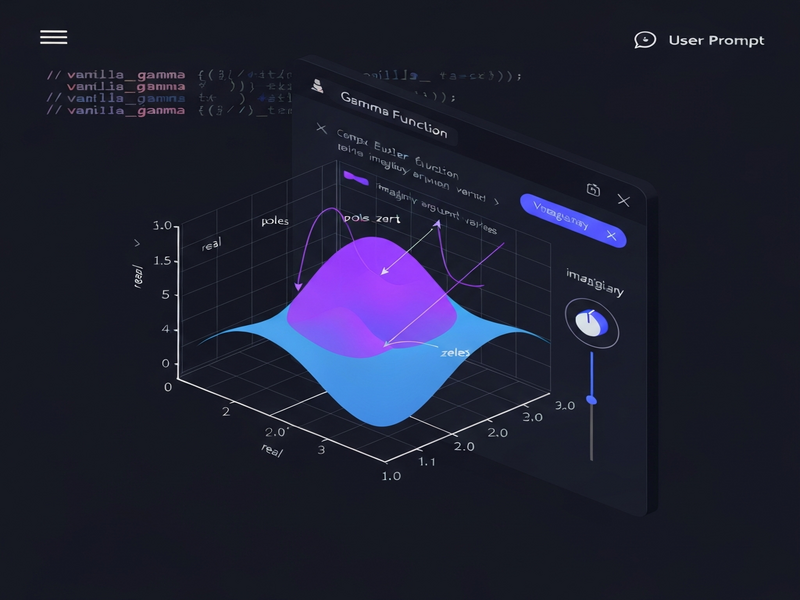
Built on the UBOS platform overview, the visualization runs entirely in the browser, leveraging WebGL and modern JavaScript math libraries. Users can input a complex argument z = x + i·c and watch two curves evolve:
- Blue curve: the real part
Re Γ(z) - Purple curve: the imaginary part
Im Γ(z)
The interface starts with c = 0, displaying the classic real‑axis Gamma function. As you slide the imaginary component, the graph morphs, revealing poles, zeros, and the intricate spirals that characterize Γ(z) in the complex domain.
Technical Foundation
The engine behind the scenes re‑uses the open‑source vanilla_gamma() routine originally published on Zeta Calculator. UBOS wrapped this routine in a React‑based UI, added a high‑performance rendering layer, and exposed the functionality through its Web app editor on UBOS. The result is a zero‑install, cross‑platform experience that runs on any modern browser.
Key Features and Technical Details
UBOS designed the tool with a MECE (Mutually Exclusive, Collectively Exhaustive) mindset, ensuring each feature serves a distinct purpose without overlap.
1. Interactive Parameter Controls
- Slider for the real part
x(range −10 to 10) - Slider for the imaginary part
c(range −5 to 5) - Numeric input boxes for precise values
2. Real‑Time Rendering
- GPU‑accelerated canvas using WebGL
- Instant update of both Re Γ(z) and Im Γ(z) curves
- Dynamic color coding for easy visual distinction
3. Data Export & Sharing
- Download CSV of sampled points
- Export high‑resolution PNG of the current view
- One‑click share link that preserves current parameters
4. Integration Hooks
- REST endpoint for programmatic queries
- Webhooks to trigger Workflow automation studio actions
- Ready‑to‑use OpenAI ChatGPT integration for natural‑language explanations of results
Use Cases and Target Audience
The tool is deliberately built for four primary personas, each benefiting from a different slice of its capabilities.
- Mathematicians & Researchers: Quickly test conjectures about pole locations, explore asymptotic behavior, and generate publication‑ready figures without leaving the browser.
- Physics & Engineering Scientists: Model special‑function solutions in quantum field theory or statistical mechanics, then export data for simulation pipelines.
- Educators & Instructors: Demonstrate the transition from real to complex arguments live in lectures, using the UBOS templates for quick start to embed the widget in LMS pages.
- Students & Self‑Learners: Gain intuition through hands‑on experimentation, supported by the AI marketing agents that can answer “why does the curve dip here?” in natural language.
How to Access and Use the Gamma Function Tool
Getting started takes less than two minutes. Follow these steps:
- Visit the UBOS homepage and click “Explore Apps”.
- Select “Gamma Function Visualization” from the UBOS portfolio examples list.
- If you don’t have an account, sign up for a free tier – see the UBOS pricing plans for details.
- Once inside the app, use the sliders or type values directly to adjust
xandc. Observe the blue and purple curves update instantly. - To embed the visualization in your own project, click “Export Widget”. UBOS will generate a snippet that can be dropped into any HTML page, powered by the Web app editor on UBOS.
- For advanced workflows, connect the tool to the Workflow automation studio to trigger alerts when the function exceeds a threshold, or pipe results into the Chroma DB integration for vector‑based storage.
Developers can also call the underlying API directly. The endpoint returns JSON with real and imag fields, making it trivial to feed results into custom dashboards or Jupyter notebooks.
Extending the Experience with UBOS AI Services
UBOS’s ecosystem offers a suite of AI‑enhanced modules that can augment the Gamma visualization:
- ChatGPT and Telegram integration – ask a bot to compute Γ(z) for any complex number and receive a plotted image via Telegram.
- ElevenLabs AI voice integration – let a synthetic voice read out the numeric result as you explore the graph.
- Use the AI SEO Analyzer to optimize any research blog that references the Gamma tool, ensuring maximum discoverability.
- Generate explanatory text with the AI Article Copywriter for documentation or teaching material.
SEO Meta Description & Image Alt Text
Meta description: “Explore UBOS’s interactive Gamma Function visualization tool – a real‑time, web‑based platform for mathematicians, physicists, educators, and students to analyze complex arguments of the Euler Gamma function with rich features, export options, and seamless integration into the UBOS AI ecosystem.”
Image alt text: “Interactive Gamma Function visualization on UBOS platform showing real (blue) and imaginary (purple) components as sliders adjust the complex argument.”
Original Source
The underlying concept for this visualization was originally presented in a community‑driven project documented on Zeta Calculator. UBOS has extended that foundation with a modern UI and AI‑ready integrations.
Conclusion: A New Lens on an Old Function
By turning the abstract Gamma function into an interactive, shareable graphic, UBOS empowers a broad audience—from graduate researchers to high‑school teachers—to see mathematics in motion. The tool’s open API, seamless export options, and tight coupling with the broader UBOS AI suite make it not just a demo, but a production‑ready component for any scientific or educational workflow. Whether you are building a research paper, a classroom demo, or an AI‑enhanced analytics pipeline, the Gamma Function visualization offers a fresh, hands‑on perspective on one of mathematics’ most celebrated functions.
Ready to try it yourself? Jump to the UBOS homepage and start exploring the complex plane today.