
- Updated: February 20, 2026
- 7 min read
How to Master the Next.js Turbopack Codebase with a Custom Visualizer
Mastering the Next.js Turbopack Codebase with a Visualizer: A Hands‑On Guide
The fastest way to understand the Next.js Turbopack codebase is to set a concrete learning goal, make small, observable edits, and then build a lightweight visualizer that streams file‑level events over a WebSocket – a method proven by developers who dissected Turbopack’s Rust internals.
Why Turbopack Matters for Modern Web Development
Since its debut, Next.js Turbopack has positioned itself as the successor to Webpack, promising sub‑second builds, aggressive tree‑shaking, and native Rust performance. For developers accustomed to JavaScript‑only toolchains, the shift to a mixed‑language codebase (JavaScript + Rust) can feel like stepping into a black box. The challenge isn’t just “how do I get it to compile?” but “how does the bundler decide what code to keep, discard, or transform?” This article walks you through a reproducible learning workflow that demystifies those decisions, using a visualizer you can build in a single weekend.
Step‑by‑Step Walkthrough of the Author’s Approach
1️⃣ Define a Laser‑Focused Goal
The first mistake many newcomers make is treating the whole repository as a single learning unit. Instead, isolate a narrow question. In the original experiment the goal was: “Understand why a dead enum stays in the final bundle when using Turbopack’s tree‑shaking.” By anchoring the investigation to a concrete bug report, you gain a clear success metric – the enum should disappear after the fix.
2️⃣ Edit Randomly to Surface Execution Paths
Once the goal is set, make a harmless change that forces the compiler to re‑run a specific module. For example, insert a println!("HERE!") in turbopack/crates/turbopack/src/lib.rs. The output (or lack thereof) tells you whether the module is part of the build graph. This “random edit” technique is a cheap way to map hot paths without reading every file.
3️⃣ Read to Answer Targeted Questions
Use rg (ripgrep) or fd to locate symbols, then trace them through the Rust source. In our case, searching for PURE revealed a sentinel value used by SWC to mark side‑effect‑free code. Understanding that sentinel’s journey through Turbopack’s encoding logic answered the “why is the enum still present?” question.
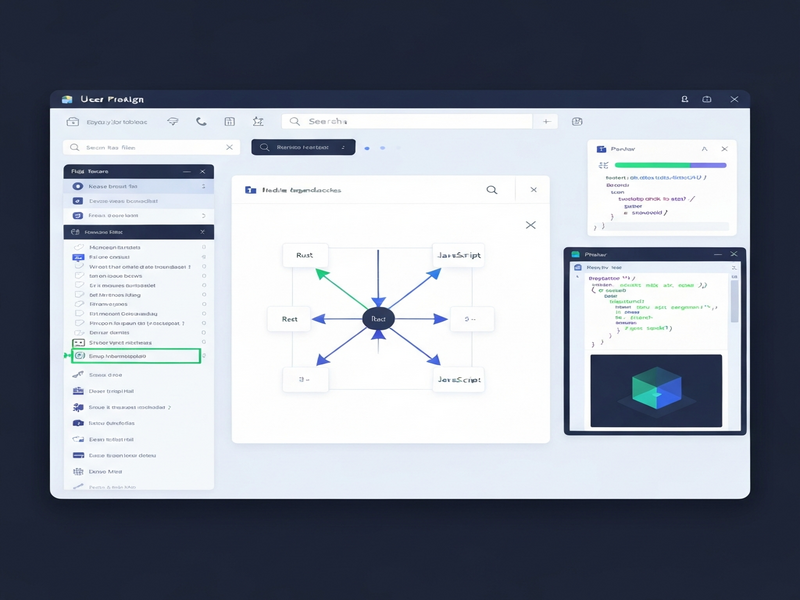
4️⃣ Build a Minimal Visualizer
The most powerful insight came from visualizing the build pipeline. The visualizer consists of three tiny pieces:
- A WebSocket server that receives JSON events from the Turbopack process.
- Instrumentation points in the Rust code that emit
{ file, event, timestamp }payloads. - A front‑end UI (plain HTML + Tailwind) that renders a live graph of tasks, dependencies, and file contents.
The UI shows pending tasks on the left, active parses in the middle, and completed chunks on the right. When you edit a file, the visualizer instantly highlights the affected nodes, making the abstract “incremental computation” model concrete.
“Seeing the graph unfold in real time turned a bewildering codebase into a series of understandable steps.” – Jimmy Miller
Key Technical Insights Uncovered
Rust Modules and the Turbopack Crate Layout
Turbopack lives under turbopack/crates/ with 54 individual crates. The most relevant for tree‑shaking are turbopack-core, turbopack-ecmascript, and turbopack-node. Each crate exports a Vc (ValueCell) type that powers the lazy, incremental graph – similar to the Salsa framework.
Tree‑Shaking Mechanics
Turbopack’s tree‑shaking relies on two signals:
- Pure annotations (e.g.,
/* #__PURE__ */) that tell the optimizer a function has no side effects. - A BytePos encoding that merges module IDs with source offsets to keep memory usage low.
The bug we explored stemmed from the BytePos::PURE sentinel being mis‑interpreted as a regular module offset, preventing the optimizer from discarding dead code. The fix adds a guard for pos.is_pure() before encoding.
Tooling Around Turbopack
The ecosystem includes:
- UBOS resources on Next.js Turbopack – a curated guide for developers.
- Vercel’s official trace viewer (performance‑focused) – useful for profiling but not for code‑flow understanding.
- Community‑built visualizers (like the one described) that expose the internal task graph.
Benefits of Using a Codebase Visualizer
When you pair a visualizer with Turbopack, you gain:
- Instant feedback on which modules are re‑executed after a change.
- Reduced cognitive load by turning abstract async Rust tasks into a concrete graph.
- Faster onboarding for new team members – they can watch the build pipeline instead of reading endless docs.
- Bug‑hunting power – you can pinpoint why a particular symbol survives tree‑shaking.
- Performance tuning insights – identify hot paths that dominate build time.
How UBOS Can Accelerate Your Turbopack Exploration
Building a visualizer from scratch is rewarding, but you don’t have to start from zero. The UBOS homepage offers a suite of low‑code tools that let you prototype the same workflow in minutes:
- Use the Web app editor on UBOS to spin up a Node.js server that proxies Turbopack events.
- The Workflow automation studio lets you define “on file change → emit WebSocket event” without writing boilerplate.
- Kick‑start the UI with UBOS templates for quick start, many of which already include Tailwind components and real‑time charts.
- For teams that need AI‑enhanced insights, integrate AI marketing agents to automatically summarize build logs or suggest optimizations.
- When budgeting, compare the UBOS pricing plans – the free tier is sufficient for a personal Turbopack visualizer, while the Pro tier adds multi‑project dashboards.
If you’re a startup, the UBOS for startups program gives you early‑stage credits, perfect for experimenting with heavy‑weight tooling like Turbopack. For SMBs, the UBOS solutions for SMBs include pre‑configured CI pipelines that already run Turbopack in watch mode.
Enterprises can leverage the Enterprise AI platform by UBOS to combine Turbopack visualizations with other observability data (e.g., APM, logs) in a single dashboard.
Need a ready‑made AI‑powered component? Try the AI Video Generator to turn your build‑graph recordings into short explainer videos for internal training. Or use the AI SEO Analyzer to ensure your documentation stays search‑engine friendly.
For content creators, the AI Article Copywriter can draft release notes automatically from visualizer logs, while the AI Survey Generator helps you collect developer feedback on the new workflow.
All of these integrations are listed in the UBOS portfolio examples, showcasing real‑world projects that combined Rust‑based bundlers with low‑code platforms.
Conclusion – Take the Next Step
Learning a massive codebase like Next.js Turbopack doesn’t require weeks of reading endless source files. By setting a precise goal, making observable edits, and visualizing the build graph, you turn an opaque system into a series of clear, actionable steps. The approach scales: you can reuse the same visualizer to explore other parts of the repository, from the Rust compiler front‑end to the JavaScript plugin ecosystem.
Ready to try it yourself? Grab the About UBOS page for a quick overview of the team behind the platform, then dive into the UBOS platform overview to spin up your own visualizer in under an hour.
For a deeper dive into the original methodology, read Jimmy Miller’s original article. It walks you through the exact bug‑report selection, the Rust edits, and the final visualizer screenshots that inspired this guide.
Start building, start visualizing, and turn Turbopack’s complexity into your competitive advantage.