
- Updated: February 15, 2026
- 6 min read
Seeing Theory: Interactive Platform Revolutionizes Statistics Education
Seeing Theory is an interactive, visual platform that teaches probability and statistics through dynamic web‑based visualizations, making complex concepts instantly understandable for students, educators, and data‑science enthusiasts.
Seeing Theory: The Interactive Statistics Hub Redefining Data‑Science Learning
Imagine mastering probability distributions with a drag‑and‑drop graph, or watching Bayesian inference unfold in real time—all without opening a textbook. The Seeing Theory website delivers exactly that experience, turning abstract math into tactile, visual stories. Launched by a Brown University undergraduate, the platform blends D3.js visualizations with pedagogical rigor, offering a free, open‑source resource that has quickly become a go‑to reference for anyone diving into data science.
Mission: Making Statistics Accessible Through Interaction
Seeing Theory’s core mission is simple yet ambitious: democratize statistical education by replacing static equations with interactive demos. The creators believe that visual intuition accelerates learning, especially for concepts that traditionally rely on dense notation. By providing a browser‑based playground, the site empowers learners to experiment, observe outcomes, and develop a deeper, lasting understanding.
The platform is organized into six progressive chapters, each focusing on a cornerstone of statistical theory. Every chapter contains multiple modules, each equipped with sliders, animated charts, and instant feedback loops. This structure aligns perfectly with modern constructivist teaching methods, where learners build knowledge through active exploration.
Key Interactive Chapters at a Glance
Basic Probability
Start with the fundamentals: chance events, expectation, and variance. The module lets you flip virtual coins, roll dice, and instantly see probability trees update, reinforcing the law of large numbers through visual repetition.
Compound Probability
Dive deeper into set theory, counting principles, and conditional probability. Interactive Venn diagrams illustrate how overlapping events affect outcomes, while a live Bayes’ theorem calculator demonstrates real‑world inference.
Probability Distributions
Explore discrete vs. continuous variables, the Central Limit Theorem, and sampling distributions. Drag sliders to reshape normal, binomial, and Poisson curves, watching how mean and variance shift in real time.
Frequentist Inference
Learn point estimation, confidence intervals, and bootstrap methods. The module generates synthetic datasets on the fly, letting you compare theoretical intervals with empirical results.
Bayesian Inference
Visualize prior, likelihood, and posterior distributions with an intuitive slider interface. The interactive demo shows how new data reshapes beliefs, a crucial skill for modern data scientists.
Regression Analysis
Model linear relationships using ordinary least squares, correlation, and ANOVA. Drag data points on a scatter plot and watch the regression line adjust, instantly revealing residuals and goodness‑of‑fit metrics.
A Fresh Illustration: Visualizing the Learning Journey
To celebrate Seeing Theory’s impact, UBOS’s AI engine generated a custom illustration that captures the platform’s essence—a vibrant mosaic of charts, sliders, and data points converging into a light‑bulb moment. The image underscores how interactive visuals transform abstract formulas into intuitive insights.
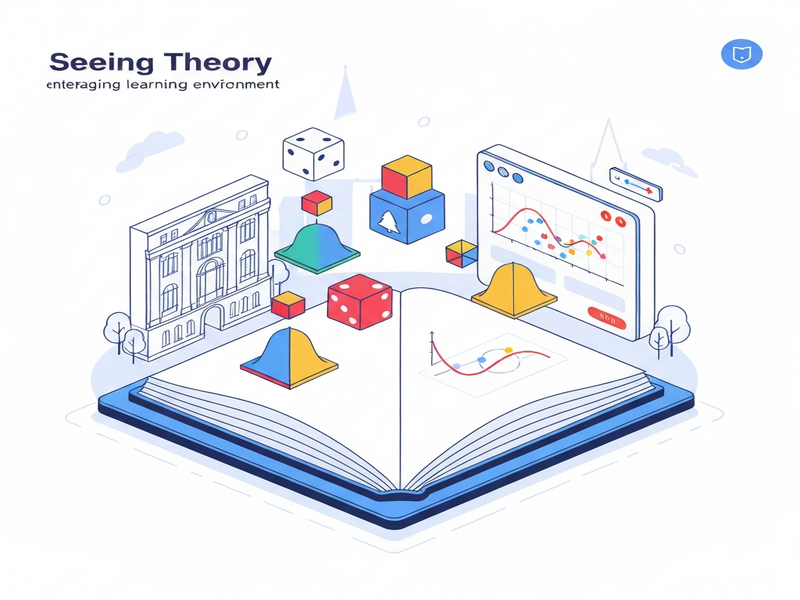
This graphic not only adds visual appeal but also serves as a mnemonic device for learners: each colored segment represents a chapter, reminding users that mastery comes from exploring each piece of the statistical puzzle.
Why Learners Choose Seeing Theory
- Active Engagement: Real‑time manipulation of variables cements concepts faster than passive reading.
- Immediate Feedback: Errors are highlighted instantly, allowing learners to correct misconceptions on the spot.
- Scalable Learning Path: From high‑school basics to graduate‑level inference, the chapters grow with the user.
- Open‑Source Flexibility: Educators can embed modules into LMS platforms or customize the D3.js code for classroom projects.
- Cross‑Disciplinary Relevance: Whether you’re studying biology, economics, or computer science, the visual tools translate across domains.
Take Your Data‑Science Journey Further with UBOS
Seeing Theory proves that interactive learning drives mastery. At UBOS homepage, we extend that philosophy to AI‑powered business solutions. Whether you’re a student building a portfolio or an enterprise scaling analytics, UBOS offers tools that turn ideas into deployable apps without writing a single line of code.
Build Faster with No‑Code
Explore the UBOS platform overview to create custom dashboards, data pipelines, and AI agents in minutes.
Need a quick prototype? Jump straight into the UBOS templates for quick start—including the AI SEO Analyzer and AI Article Copywriter—to see immediate results.
Integrate Smarter Communication
Leverage the Telegram integration on UBOS to push real‑time analytics alerts to your team’s chat.
Combine it with the ChatGPT and Telegram integration for AI‑driven conversational insights.
For deeper language models, connect the OpenAI ChatGPT integration and let your apps answer statistical queries on the fly.
Advanced Data Stores & Voice
Store vector embeddings with the Chroma DB integration, perfect for similarity search in large datasets.
Give your applications a human touch using the ElevenLabs AI voice integration for natural‑sounding narration of statistical results.
Tailored Solutions for Every Scale
Start small with UBOS solutions for SMBs, or scale to the Enterprise AI platform by UBOS for enterprise‑grade governance.
Entrepreneurs can accelerate go‑to‑market using UBOS for startups, while marketers benefit from AI marketing agents that personalize campaigns at scale.
Create, Automate, and Monetize
Design interactive web apps with the Web app editor on UBOS, then automate workflows using the Workflow automation studio.
Review real‑world success stories in our UBOS portfolio examples and see how others have turned data insights into revenue.
Transparent Pricing & Partnerships
Choose a plan that fits your budget with UBOS pricing plans. Join the UBOS partner program to co‑create solutions and expand your market reach.
Learn more about our story at About UBOS.
Ready to blend interactive statistics with AI‑driven automation? Dive into the UBOS ecosystem today and transform the way you learn, teach, and build data products.
Conclusion: Visual Learning as the Future of Data Science
Seeing Theory has set a new benchmark for how probability and statistics can be taught—through hands‑on, visual interaction rather than static pages. Its success demonstrates a broader trend: learners expect immediate, immersive feedback, and platforms that deliver it gain rapid adoption.
By pairing such interactive resources with UBOS’s no‑code AI suite, educators and professionals can create custom learning experiences, automate data pipelines, and even embed statistical assistants directly into messaging apps. The synergy between visual education and AI automation promises a future where mastering data science is as intuitive as playing a game.
Explore Seeing Theory, experiment with its modules, and then amplify your insights with UBOS’s powerful tools. The next generation of data‑savvy creators is already building—don’t miss the wave.