

- Updated: December 28, 2025
- 7 min read
MacThrottle: Real‑Time Thermal Throttling Monitoring App for macOS
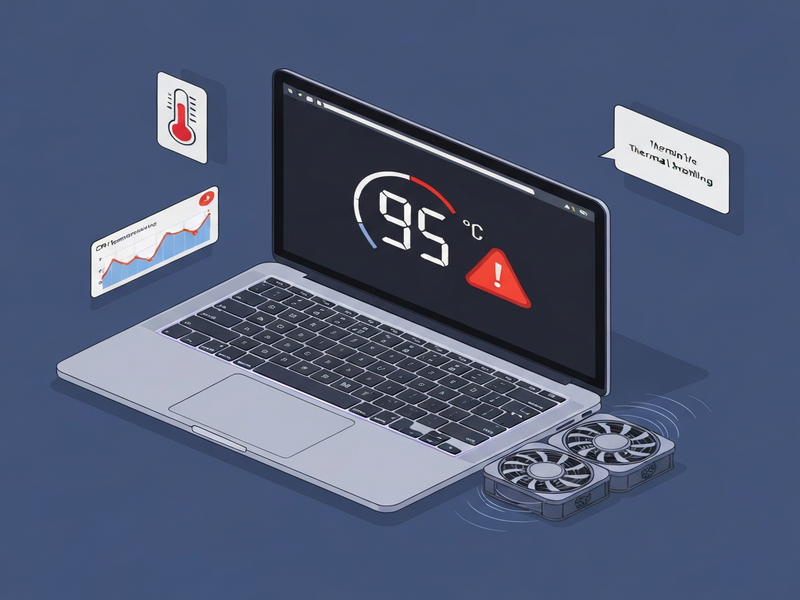
MacThrottle is a lightweight menu‑bar application that instantly tells you whether your Mac is thermally throttling, using macOS‑native APIs such as ProcessInfo.thermalState and the thermald notification system.
Why macOS Thermal Throttling Matters for Every Mac User
Modern Apple Silicon Macs deliver astonishing performance while keeping power consumption low. However, when the silicon die approaches its safe temperature ceiling (≈110 °C), the system deliberately reduces CPU/GPU clock speeds – a process known as thermal throttling. The result? Slower applications, jittery UI, and in extreme cases, unexpected shutdowns. Detecting throttling early lets you adjust workloads, improve cooling, or change display settings before performance degrades.
For developers, throttling can mask real‑world benchmark results, while IT professionals need reliable metrics to size cooling solutions in bulk deployments. That’s why a transparent, programmatic view of the thermal state is essential.
macOS Thermal Throttling: A Quick Technical Overview
Apple Silicon integrates a dedicated thermal controller that monitors multiple temperature sensors (CPU, GPU, memory, and package). When the aggregate heat exceeds predefined thresholds, the controller raises the thermal pressure level and the OS responds by:
- Lowering CPU/GPU frequencies.
- Reducing turbo boost windows.
- Increasing fan speed (on fan‑equipped models).
- Issuing system notifications to apps that have subscribed to the thermal pressure events.
The pressure levels are defined in OSThermalNotification.h as:
| Level | Numeric Code | Typical Impact |
|---|---|---|
| Nominal | 0 | Full performance, fans idle. |
| Moderate | 1 | Slight frequency reduction, fan may spin. |
| Heavy | 2 | Noticeable throttling, fan at higher RPM. |
| Trapping | 3 | Aggressive throttling, possible UI stutter. |
| Sleeping | 4 | System may enter low‑power state to protect hardware. |
Understanding these levels is the first step toward building tools that surface the information in a user‑friendly way.
Programmatic Detection Methods on macOS
Apple provides several APIs, each with its own granularity and permission model. Below is a MECE breakdown of the three most reliable approaches.
1. ProcessInfo.thermalState (Swift/Objective‑C)
The simplest, sandbox‑friendly method is the ProcessInfo.thermalState property. It returns an enum with four states: .nominal, .fair, .serious, and .critical. Example:
import Foundation
print(ProcessInfo.processInfo.thermalState)
Pros: No elevated privileges, works in any app, instant response.
Cons: The mapping to actual throttling is coarse; both “moderate” and “heavy” map to .fair, making it hard to differentiate real throttling from mild heat.
2. powermetrics (CLI, requires root)
The powermetrics command‑line tool provides a detailed thermal pressure level, CPU frequency, and power draw. Example output:
sudo powermetrics -s thermal
*** Thermal pressure ***
Current pressure level: Heavy
Pros: Highest granularity, includes per‑core frequencies and power consumption.
Cons: Requires sudo, not suitable for App Store distribution, and can be noisy in logs.
3. thermald IPC notifications (notifyd)
The thermald daemon publishes the current pressure level to the Darwin notification system (notifyd) under the key com.apple.system.thermalpressurelevel. By registering for this notification, an app can receive real‑time updates without root.
let name = "com.apple.system.thermalpressurelevel"
var token: Int32 = 0
notify_register_check(name, &token)
var state: UInt64 = 0
notify_get_state(token, &state)
print(state) // 0 = nominal, 1 = moderate, …
Pros: No elevated privileges, instantaneous updates, aligns with the OS‑level pressure levels.
Cons: Requires a small amount of native code (Swift/Obj‑C) and careful handling of the notification lifecycle.
For most user‑facing tools, the thermald notification method offers the best balance of accuracy and usability – exactly the approach used by the MacThrottle app.
MacThrottle: The First‑Class macOS Thermal‑State Menu Bar App
Built with SwiftUI and the MenuBarExtra scene, MacThrottle (the name is illustrative) surfaces the current thermal pressure level in a compact thermometer icon. The app runs entirely in user space, leveraging the thermald notification channel, so it never asks for admin rights after the optional helper installation.
Key Features
- Real‑time pressure level: Green (Nominal) → Yellow (Moderate) → Orange (Heavy) → Red (Critical).
- Temperature & fan graph: A 10‑minute sparkline shows CPU temperature and fan speed side‑by‑side.
- macOS notifications: Optional alerts when the pressure level changes, perfect for developers running heavy builds.
- Login‑item support: One‑click enable/disable auto‑launch via
SMAppService. - Exportable data: CSV dump of pressure, temperature, and fan RPM for post‑mortem analysis.
Design Philosophy
MacThrottle follows a minimal‑distraction principle. The menu‑bar icon occupies only a few pixels, the tooltip shows the exact numeric state, and the optional pop‑over graph appears only on hover. This design aligns with macOS’s clean UI guidelines while delivering power‑user data.
Why MacThrottle Is a Game‑Changer for Tech‑Savvy Users, Developers, and IT Pros
For Power Users & Creators
- Detect throttling before video rendering stalls.
- Adjust external monitor resolution or brightness on the fly.
- Combine with AI marketing agents to schedule heavy tasks during cool periods.
For Developers & QA Engineers
- Integrate thermal data into CI pipelines to flag performance regressions.
- Use the CSV export to correlate test suite duration with thermal pressure.
- Leverage the Workflow automation studio to trigger alerts in Slack or Teams.
For IT Administrators & Enterprises
- Monitor fleet‑wide thermal health via remote logging.
- Plan hardware refresh cycles based on real‑world thermal data.
- Combine with the Enterprise AI platform by UBOS to predict overheating events.
For Startups & SMBs
- Save on cooling infrastructure by optimizing workloads.
- Use the UBOS for startups free tier to prototype thermal‑aware SaaS tools.
How to Install and Use MacThrottle on Your Mac
- Download the binary: Grab the latest release from the GitHub releases page.
- Allow execution: Open
System Settings → Privacy & Securityand approve the app under “Allow apps downloaded from”. - Optional helper installation: If you want the CSV logger, the installer will prompt for admin credentials to create a launch daemon. This helper runs
powermetricsin the background and writes JSON to/tmp/mac-throttle-thermal-state. - Launch the app: It appears as a tiny thermometer in the menu bar. Click to expand the pop‑over graph.
- Configure notifications: In the pop‑over, toggle “Alert on Heavy/Critical” to receive macOS banners.
- Enable auto‑start: Use the “Start at login” switch; under the hood it registers an
SMAppServicelogin item.
For users who prefer a no‑code approach, the same functionality can be recreated in the Web app editor on UBOS by pulling the com.apple.system.thermalpressurelevel notification into a custom dashboard widget.
Extending MacThrottle with the UBOS Platform
UBOS provides a suite of low‑code tools that can consume the thermal data emitted by MacThrottle, turning a simple status icon into a full‑blown monitoring solution.
- Use the UBOS templates for quick start to build a dashboard that visualizes temperature trends across multiple devices.
- Leverage the AI SEO Analyzer template to automatically generate performance reports that include thermal health metrics.
- Integrate with UBOS partner program to offer thermal‑aware SaaS products to your customers.
- Combine with the AI YouTube Comment Analysis tool to schedule heavy video rendering when the Mac is in a nominal state.
All of these integrations are built on the UBOS platform overview, which abstracts away the underlying macOS APIs and lets you focus on business logic.
Pricing, Support, and Where to Get Help
The core MacThrottle app is open source and free. If you need advanced logging, enterprise‑grade alerting, or custom UI skins, UBOS offers a UBOS pricing plans that include dedicated support and SLA guarantees.
Community support is available on the GitHub issues page. For enterprise customers, the About UBOS page lists contact options for a dedicated account manager.
Take Control of Your Mac’s Performance Today
Thermal throttling is no longer a hidden mystery. With the MacThrottle app you get instant visibility, actionable alerts, and the ability to feed that data into larger automation pipelines powered by UBOS. Whether you’re a developer chasing benchmark fidelity, a creator protecting render jobs, or an IT admin safeguarding a fleet, real‑time thermal insight is the missing link.
Ready to try it? Visit the UBOS homepage for the latest release, explore the UBOS portfolio examples, and start building smarter, cooler workflows today.
For a deeper technical dive, read the original announcement on Stanislas’s blog. The article details the low‑level code snippets and performance tests that inspired MacThrottle’s design.