From vibe coding to vibe deployment. UBOS MCP turns ideas into infra with one message.
LLDB-MCP

See it in acton here, automatically debugging a buffer overflow: https://x.com/full_duplex/status/1904770477698277847
Overview
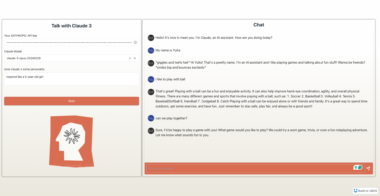
LLDB-MCP is a tool that integrates the LLDB debugger with Claude’s Model Context Protocol (MCP). This integration allows Claude to start, control, and interact with LLDB debugging sessions directly, enabling AI-assisted debugging workflows.
The tool provides a comprehensive set of commands for working with LLDB, including:
- Starting and managing LLDB sessions
- Loading programs for debugging
- Setting breakpoints and watchpoints
- Controlling program execution
- Examining memory, registers, and variables
- Analyzing stack traces and program state
Features
- Create and manage multiple LLDB debugging sessions
- Load executables and attach to running processes
- Load core dump files for post-mortem analysis
- Execute arbitrary LLDB commands
- Fine-grained control over program execution
- Memory examination and disassembly
- Thread and stack frame inspection
Installation
Clone the repository:
git clone https://github.com/stass/lldb-mcp.git
cd lldb-mcp
Install dependencies:
pip install mcpConfigure Claude to use the LLDB-MCP server:
- Open the Claude desktop app configuration
- Add the following to your MCP configuration:
"mcpServers": {
  "lldb-mcp": {
    "command": "python3",
    "args": ["/path/to/lldb-mcp/lldb_mcp.py"],
    "disabled": false
  }
}
Usage
Once installed and configured, you can interact with LLDB through Claude using natural language.
Basic Workflow
- Start a new LLDB session
- Load a program
- Set breakpoints
- Run the program
- Inspect variables and memory
- Control execution (continue, step, next, etc.)
- Terminate the session when done
Example Commands
Here are some examples of how to interact with LLDB-MCP through Claude:
- “Start a new LLDB session”
- “Load the program ‘/path/to/executable’”
- “Set a breakpoint at main”
- “Run the program”
- “Show backtrace”
- “Print the value of variable ‘count’”
- “Step over the next line”
- “Examine memory at address 0x1000”
- “Show register values”
- “Continue execution”
- “Kill the process”
- “Terminate the LLDB session”
Supported Commands
Session Management
lldb_start: Start a new LLDB sessionlldb_terminate: Terminate an LLDB sessionlldb_list_sessions: List all active LLDB sessions
Program Loading
lldb_load: Load a program into LLDBlldb_attach: Attach to a running processlldb_load_core: Load a core dump file
Execution Control
lldb_run: Run the loaded programlldb_continue: Continue program executionlldb_step: Step to next line or instructionlldb_next: Step over function callslldb_finish: Execute until the current function returnslldb_kill: Kill the running process
Breakpoints and Watchpoints
lldb_set_breakpoint: Set a breakpointlldb_breakpoint_list: List all breakpointslldb_breakpoint_delete: Delete a breakpointlldb_watchpoint: Set a watchpoint on a variable or memory address
Inspection
lldb_backtrace: Show call stacklldb_print: Print value of expressionlldb_examine: Examine memorylldb_info_registers: Display registerslldb_frame_info: Get detailed information about a stack framelldb_disassemble: Disassemble codelldb_process_info: Get information about the current process
Thread Management
lldb_thread_list: List all threads in the current processlldb_thread_select: Select a specific thread
Miscellaneous
lldb_command: Execute an arbitrary LLDB commandlldb_expression: Evaluate an expression in the current framelldb_help: Get help for LLDB commands
Example program
example/overflow.c contains an example C program that causes buffer overflow with certain arguments.
Compile it using cc overflow.c and ask Claude to debug the issue with the resulting program:
I'm trying to debug my program a.out that is crashing with certain arguments, e.g. when I pass "hello".
Can you help me debug it?
Debugging Tips
- Use
lldb_commandwhen you need to execute LLDB commands that don’t have a dedicated function - Enable debug mode with
--debugflag when starting the server for detailed logging - Sessions are automatically cleaned up when the server shuts down
- Each session has a unique ID - make sure to use the correct ID when executing commands
Requirements
- Python 3.7+
- LLDB installed on the system
- Claude desktop app with MCP support
Troubleshooting
- If LLDB commands are timing out, check that LLDB is installed correctly
- Verify the path to LLDB when starting a new session
- Check for permission issues when attaching to processes
- Review debug logs if commands aren’t executing correctly
License
BSD 2-clause
LLDB Debugger Integration

Project Details
- stass/lldb-mcp
- BSD 2-Clause "Simplified" License
- Last Updated: 4/16/2025
Recomended MCP Servers
An MCP server to wrap ripgrep

Analyzes your codebase identifying important files based on dependency relationships. Generates diagrams and importance scores per file, helping...
An open source framework for building AI-powered apps with familiar code-centric patterns. Genkit makes it easy to develop,...
AI-Powered Revit Modeling
Infisical's official MCP server.
MCP server that provides LLM with tools for interacting with EVM networks
MCP server for interacting with RabbitMQ
A MCP (Model Context Protocol) server that provides automated GUI testing and control capabilities through PyAutoGUI.
K8s-mcp-server is a Model Context Protocol (MCP) server that enables AI assistants like Claude to securely execute Kubernetes...
This repo hosts an MCP server for volatility3.x
MCP server for RAG-based document search and management
Help LLMs to understand your Next apps better
Featured Templates
View More