
- Updated: March 19, 2026
- 7 min read
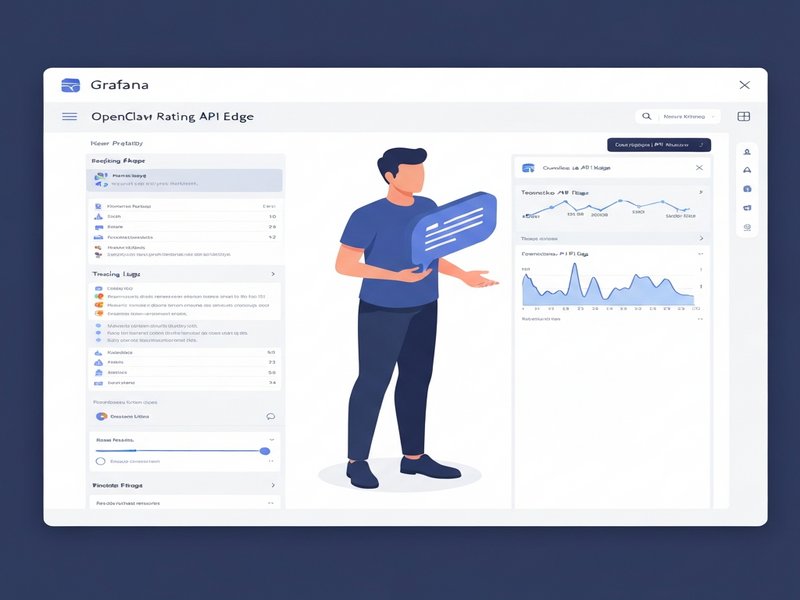
Unified Observability Dashboard for OpenClaw Rating API Edge
Unified observability for the OpenClaw Rating API Edge is achieved by combining OpenTelemetry tracing, Loki log aggregation, and a Grafana dashboard that visualizes traces, logs, and metrics in a single pane.
Introduction
Micro‑service ecosystems like OpenClaw generate a flood of telemetry data—spans from distributed traces, structured logs, and time‑series metrics. Without a unified view, DevOps engineers spend precious minutes correlating events across disparate tools, which slows incident response and inflates operational costs.
This guide walks you through a step‑by‑step tutorial to build a single Grafana dashboard that surfaces traces, logs, and metrics for the OpenClaw Rating API Edge. By the end, you’ll have a live observability stack that lets you drill from a metric straight into the related log line or trace span, just as described in the original LinkedIn article “Building a Unified Observability Dashboard with Grafana”.
Prerequisites
- Docker & Docker‑Compose (≥ 20.10) installed on your workstation.
- Access to a Kubernetes cluster (minikube or kind works for testing).
- Basic familiarity with UBOS platform overview concepts—especially the Workflow automation studio for CI/CD pipelines.
- OpenTelemetry SDK for your language (Node.js, Python, or Go). This guide uses the
opentelemetry‑sdk‑pythonexample. - Grafana ≥ 9.0, Loki ≥ 2.8, and Tempo ≥ 1.5 containers (all available via the official Docker images).
Setting up OpenTelemetry tracing for OpenClaw Rating API Edge
OpenTelemetry provides a vendor‑agnostic way to emit trace data. For OpenClaw, we instrument the Rating API Edge service to capture HTTP request/response cycles, database calls, and external API interactions.
1. Install the SDK
pip install opentelemetry-sdk opentelemetry-instrumentation-flask opentelemetry-exporter-otlp2. Configure the OTLP exporter to send spans to Tempo
import os
from opentelemetry import trace
from opentelemetry.sdk.resources import Resource
from opentelemetry.sdk.trace import TracerProvider
from opentelemetry.sdk.trace.export import BatchSpanProcessor
from opentelemetry.exporter.otlp.proto.grpc.trace_exporter import OTLPSpanExporter

resource = Resource(attributes={
    "service.name": "openclaw-rating-api",
    "service.version": "1.0.0",
    "deployment.environment": "production"
})

trace.set_tracer_provider(TracerProvider(resource=resource))
otlp_exporter = OTLPSpanExporter(endpoint=os.getenv("OTEL_EXPORTER_OTLP_ENDPOINT", "http://tempo:4317"))
span_processor = BatchSpanProcessor(otlp_exporter)
trace.get_tracer_provider().add_span_processor(span_processor)
3. Auto‑instrument Flask (or FastAPI) routes
from opentelemetry.instrumentation.flask import FlaskInstrumentor
from flask import Flask, request, jsonify

app = Flask(__name__)
FlaskInstrumentor().instrument_app(app)

@app.route("/rate", methods=["POST"])
def rate():
    # Business logic here
    return jsonify({"status": "ok"})
Set the environment variable OTEL_EXPORTER_OTLP_ENDPOINT to point at the Tempo service (e.g., http://tempo:4317) in your docker‑compose.yml.
Configuring Loki for log aggregation
Loki ingests structured logs and makes them searchable alongside traces. The OpenClaw services already emit JSON logs; we only need to ship them to Loki.
1. Add a Loki sidecar to the Docker Compose file
services:
  rating-api:
    image: openclaw/rating-api:latest
    environment:
      - LOG_LEVEL=info
    depends_on:
      - loki
    logging:
      driver: "json-file"
      options:
        max-size: "10m"
        max-file: "3"

  loki:
    image: grafana/loki:2.8.2
    ports:
      - "3100:3100"
    command: -config.file=/etc/loki/local-config.yaml
    volumes:
      - ./loki-config.yaml:/etc/loki/local-config.yaml
2. Loki configuration (loki-config.yaml)
auth_enabled: false
server:
  http_listen_port: 3100
  log_level: info
ingester:
  lifecycler:
    address: 127.0.0.1
    ring:
      kvstore:
        store: inmemory
      replication_factor: 1
schema_config:
  configs:
    - from: 2020-10-24
      store: boltdb-shipper
      object_store: filesystem
      schema: v11
      index:
        prefix: index_
        period: 24h
storage_config:
  boltdb_shipper:
    active_index_directory: /tmp/loki/index
    cache_location: /tmp/loki/cache
    shared_store: filesystem
  filesystem:
    directory: /tmp/loki/chunks
Once Loki is up, you can verify ingestion by querying http://localhost:3100/loki/api/v1/query?query={job="rating-api"}.
Creating a Grafana unified dashboard (traces, logs, metrics)
Grafana’s Explore view lets you link traces, logs, and metrics automatically when the data sources share common labels (e.g., traceID). The following steps create a reusable dashboard for the Rating API Edge.
1. Add data sources
- Open Grafana → Configuration → Data Sources → Add data source.
- Select Tempo for tracing, set the URL to
http://tempo:3200, and enable Trace to metrics. - Add Loki for logs (URL
http://loki:3100). - Add Prometheus (or Mimir) for metrics (URL
http://prometheus:9090).
2. Build the dashboard layout
Use Tailwind‑styled panels for a clean look. Below is a minimal JSON model you can import via Dashboard → Manage → Import:
{
  "title": "OpenClaw Rating API Edge – Unified Observability",
  "panels": [
    {
      "type": "timeseries",
      "title": "Request Rate (RPS)",
      "datasource": "Prometheus",
      "targets": [{ "expr": "rate(http_requests_total[1m])" }],
      "gridPos": { "x": 0, "y": 0, "w": 12, "h": 8 }
    },
    {
      "type": "trace",
      "title": "Trace Explorer",
      "datasource": "Tempo",
      "gridPos": { "x": 12, "y": 0, "w": 12, "h": 8 }
    },
    {
      "type": "logs",
      "title": "Recent Logs",
      "datasource": "Loki",
      "targets": [{ "expr": "{job=\"rating-api\"} |~ \"error|warn\" | line_format \"{{.message}}\"" }],
      "gridPos": { "x": 0, "y": 8, "w": 24, "h": 8 }
    }
  ],
  "templating": {
    "list": [
      {
        "name": "traceID",
        "type": "query",
        "datasource": "Tempo",
        "query": "label_values(traceID)",
        "refresh": 1,
        "includeAll": false
      }
    ]
  }
}
3. Enable cross‑data‑source linking
Grafana automatically adds a traceID variable to log and metric panels when you enable Trace to logs and Trace to metrics in the Tempo data source settings. This lets you click a metric point, which populates the $traceID variable and instantly shows the related trace and log entries.
Step‑by‑step tutorial with code snippets
Step 1 – Spin up the observability stack
version: "3.8"
services:
  tempo:
    image: grafana/tempo:1.5.0
    ports:
      - "3200:3200"
    command: -config.file=/etc/tempo/tempo.yaml
    volumes:
      - ./tempo.yaml:/etc/tempo/tempo.yaml

  loki:
    image: grafana/loki:2.8.2
    ports:
      - "3100:3100"
    volumes:
      - ./loki-config.yaml:/etc/loki/local-config.yaml

  prometheus:
    image: prom/prometheus:latest
    ports:
      - "9090:9090"
    volumes:
      - ./prometheus.yml:/etc/prometheus/prometheus.yml

  grafana:
    image: grafana/grafana:9.5.2
    ports:
      - "3000:3000"
    environment:
      - GF_SECURITY_ADMIN_PASSWORD=admin
    depends_on:
      - tempo
      - loki
      - prometheus
    volumes:
      - grafana-data:/var/lib/grafana

volumes:
  grafana-data:
Step 2 – Deploy the Rating API Edge with OpenTelemetry
docker run -d \
  -e OTEL_EXPORTER_OTLP_ENDPOINT="http://localhost:4317" \
  -e LOG_LEVEL=info \
  --name rating-api \
  openclaw/rating-api:latest
Step 3 – Verify telemetry flow
- Open Grafana UI and log in (admin / admin).
- Navigate to Explore → select Tempo → query a recent
traceID. - Switch the data source to Loki and confirm that the same
traceIDappears in the log results. - Switch to Prometheus and view the
http_requests_totalmetric; click a data point to auto‑populate the trace view.
Step 4 – Save and share the dashboard
Click Save dashboard, give it a name like OpenClaw Unified Observability, and enable Snapshot if you need a read‑only shareable link for stakeholders.
Adding screenshots (placeholders)
Below are placeholders where you should insert actual screenshots after you complete the setup. Replace the src attribute with your hosted image URLs.
Grafana dashboard showing panels for metrics, logs, and traces.
Detailed trace view with spans linked to logs.
Final thoughts and next steps
By unifying OpenTelemetry, Loki, and Grafana, you’ve turned a fragmented observability landscape into a single pane of glass. This not only accelerates mean time to resolution (MTTR) but also provides a data foundation for advanced AI‑driven analysis.
Consider extending the stack with the following UBOS‑powered capabilities:
- Leverage the AI marketing agents to automatically generate incident reports and post‑mortem summaries.
- Integrate OpenAI ChatGPT integration for conversational querying of your Grafana dashboards.
- Deploy the Workflow automation studio to trigger alerts, ticket creation, or auto‑scaling based on observed anomalies.
- Explore the Enterprise AI platform by UBOS for large‑scale, multi‑tenant observability across dozens of micro‑services.
When you’re ready to host OpenClaw in a production‑grade environment, the dedicated OpenClaw hosting page provides pre‑configured Docker‑Compose files, CI/CD pipelines, and managed support.
Stay tuned for upcoming tutorials on UBOS templates for quick start that will let you spin up a full observability stack with a single click.
Happy monitoring!
Andrii Bidochko
CTO UBOS
Andrii Bidochko is an AI entrepreneur and researcher focused on AI agents, reinforcement learning, and autonomous systems. He writes about the technologies shaping the future of machine intelligence, from frontier models and agent architectures to real-world AI applications.