Unleash the Power of Visual Data with the MCP Server for AntV: A Deep Dive
In today’s data-driven world, the ability to effectively visualize information is paramount. The MCP (Model Context Protocol) Server for AntV emerges as a crucial tool in this landscape, offering a seamless bridge between AI models and robust chart generation capabilities. This server, built upon the open MCP protocol, empowers users to transform raw data into compelling visual narratives, fostering deeper insights and more informed decision-making. Specifically designed for integration with tools like Claude Desktop and seamlessly compatible with the UBOS AI Agent Development Platform, the MCP Server unlocks a new era of data accessibility and understanding.
Understanding the MCP Advantage
The Model Context Protocol (MCP) standardizes how applications provide context to Large Language Models (LLMs). This protocol is key to building more intelligent and context-aware AI systems. By enabling seamless communication between applications and LLMs, MCP facilitates the creation of advanced AI solutions that can understand and respond to complex data scenarios. The MCP Server, acting as an intermediary, allows AI models to tap into external data sources and tools, extending their capabilities and enabling richer interactions.
The MCP Server for AntV excels in generating visual charts from data, leveraging the power of the AntV visualization library. AntV offers a wide array of chart types, from basic bar graphs to complex network diagrams. The MCP Server simplifies the process of chart creation, making it accessible to users with varying levels of technical expertise.
Core Features and Functionalities
The MCP Server for AntV boasts an impressive array of features designed to streamline chart generation and enhance data understanding. Key functionalities include:
- Diverse Chart Support: The server supports over 15 distinct chart types, catering to a wide range of data visualization needs. These include:
- Area Charts: Ideal for showcasing trends and changes over time.
- Bar Charts: Perfect for comparing discrete categories.
- Column Charts: Similar to bar charts but with vertical orientation, often used for time-series data.
- Dual-Axes Charts: Combine two different chart types on a single graph, useful for correlating datasets with different scales.
- Fishbone Diagrams: Excellent for root cause analysis and identifying factors contributing to a specific problem.
- Flow Diagrams: Visualize processes and workflows, highlighting key stages and decision points.
- Histogram Charts: Display the distribution of numerical data.
- Line Charts: Emphasize trends and relationships between continuous variables.
- Mind Maps: Organize and visualize ideas and concepts in a hierarchical manner.
- Network Graphs: Illustrate relationships and connections within a network.
- Pie Charts: Represent proportions and percentages of a whole.
- Radar Charts: Compare multiple variables across different categories.
- Scatter Charts: Identify correlations and patterns between two variables.
- Treemap Charts: Display hierarchical data as nested rectangles, with the size of each rectangle proportional to its value.
- Word Cloud Charts: Visualize the frequency of words in a text, highlighting the most prominent terms.
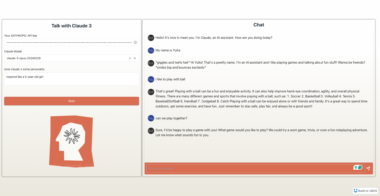
- Seamless Integration: The server is designed for easy integration with Claude Desktop, enhancing the capabilities of this powerful AI tool. The provided JSON configuration allows users to quickly connect the MCP Server and leverage its chart generation features within Claude.
- TypeScript-Based Architecture: Built on TypeScript, the server benefits from enhanced code maintainability, type safety, and scalability. This robust architecture ensures the server’s reliability and performance.
- Simplified Usage: With simple
npmcommands, users can easily install, build, and start the MCP Server. This streamlined process reduces the barrier to entry and allows users to quickly begin generating charts. - MIT License: The server is released under the MIT license, providing users with the freedom to use, modify, and distribute the software as needed.
Key Use Cases: Transforming Data into Actionable Insights
The MCP Server for AntV is a versatile tool with a wide range of applications across various industries and domains. Some key use cases include:
- Business Intelligence and Analytics: Visualize key performance indicators (KPIs), track sales trends, and analyze market data to gain valuable business insights. The diverse chart types supported by the server enable users to create comprehensive dashboards and reports that effectively communicate complex information.
- Scientific Research: Generate charts and graphs to present research findings, visualize experimental data, and identify patterns in scientific datasets. The server’s ability to create specialized charts like network graphs and scatter charts makes it particularly useful for scientific applications.
- Financial Analysis: Visualize stock prices, analyze investment portfolios, and track financial performance. The server’s support for line charts, bar charts, and dual-axes charts facilitates the creation of informative financial reports.
- Data Journalism: Create engaging and informative visualizations to accompany news articles and reports. The server’s ability to generate a wide range of chart types allows journalists to effectively communicate complex data to a broad audience.
- Educational Purposes: Use charts and graphs to illustrate concepts, explain data, and enhance learning experiences. The server can be used to create interactive visualizations that engage students and improve their understanding of complex topics.
- AI Agent Development: Integrate the MCP Server into AI Agent workflows within the UBOS platform to enable automated data visualization and reporting. AI Agents can leverage the server to generate charts on demand, providing users with real-time insights and personalized recommendations.
Integrating with the UBOS AI Agent Development Platform
The MCP Server for AntV seamlessly integrates with the UBOS AI Agent Development Platform, unlocking powerful synergies between data visualization and AI-driven automation. UBOS empowers users to orchestrate AI Agents, connect them with enterprise data, and build custom AI Agents using their own LLM models. By integrating the MCP Server, UBOS users can enhance their AI Agents with the ability to generate visual charts, providing a richer and more informative user experience.
How UBOS and MCP Server Work Together:
- Data Connection: UBOS connects AI Agents to various data sources, including databases, APIs, and cloud services.
- Data Processing: AI Agents process the data, perform analysis, and extract relevant information.
- Chart Generation: The AI Agent sends a request to the MCP Server, specifying the desired chart type and data to be visualized.
- Visualization: The MCP Server generates the chart using AntV and returns the image URL to the AI Agent.
- Presentation: The AI Agent displays the chart to the user, providing a visual representation of the data and insights.
Benefits of Integrating MCP Server with UBOS:
- Automated Data Visualization: AI Agents can automatically generate charts based on predefined rules and triggers, eliminating the need for manual chart creation.
- Real-Time Insights: Users can access real-time data visualizations that are dynamically updated as new data becomes available.
- Personalized Recommendations: AI Agents can leverage data visualizations to provide personalized recommendations and insights to users.
- Enhanced User Experience: Visual charts make data more accessible and easier to understand, improving the overall user experience.
- Streamlined Workflows: Integration simplifies data analysis and reporting workflows, saving users time and effort.
Setting Up and Running the MCP Server for AntV
Getting started with the MCP Server for AntV is a straightforward process. Follow these steps to set up and run the server:
- Install Dependencies: Use the command
npm installto install all necessary dependencies. - Build the Server: Execute the command
npm run buildto compile the TypeScript code and build the server. - Start the Server: Run the command
npm run startto start the MCP Server. The server will then be ready to receive requests and generate charts. - Configure Claude Desktop (Optional): To integrate with Claude Desktop, add the provided JSON configuration to your Claude settings. This will enable Claude to communicate with the MCP Server and utilize its chart generation capabilities.
The Future of Data Visualization with MCP and UBOS
The MCP Server for AntV represents a significant step forward in the evolution of data visualization. By leveraging the power of the MCP protocol and the capabilities of the UBOS AI Agent Development Platform, users can unlock new levels of data accessibility, understanding, and automation. As AI continues to permeate various aspects of our lives, the ability to effectively visualize and interpret data will become increasingly critical. The MCP Server for AntV, in conjunction with UBOS, is poised to play a central role in shaping the future of data visualization and empowering users to make more informed decisions.
In conclusion, the MCP Server for AntV is a powerful and versatile tool that empowers users to transform raw data into compelling visual narratives. Its seamless integration with Claude Desktop and the UBOS AI Agent Development Platform, coupled with its support for a wide range of chart types, makes it an invaluable asset for anyone seeking to unlock the power of data visualization. Embrace the future of data-driven decision-making with the MCP Server for AntV and UBOS.
Visualization Charts Server

Project Details
- antvis/mcp-server-chart
- @antv/mcp-server-chart
- MIT License
- Last Updated: 5/1/2025
Recomended MCP Servers
Claude can perform Web Search | Exa with MCP (Model Context Protocol)
Break free of your MCP Client constraints 🦹
tiny vision language model
Model Context Protocol Servers
mcp-sentry-custom
This extension enables developers to implement the MCP server features easily.
MCP Server for Ethereum Node
MCP prompt tool applying Chain-of-Draft (CoD) reasoning - BYOLLM
MCP server for usegrant
MCP server for kintone https://www.r3it.com/blog/kintone-mcp-server-20250115-yamauchi
Featured Templates
View More