

- Updated: June 10, 2026
- 7 min read
GraD-IBD: Graph Representation Learning from Diagnosis Trajectories for Early Detection of Inflammatory Bowel Disease
Direct Answer
GraD‑IBD introduces a graph‑based representation of longitudinal ICD‑10 diagnosis codes that transforms irregular, hierarchical medical histories into directed, visit‑bucketized graphs. By applying a context‑aware, time‑decay message‑passing network, the model detects early signals of inflammatory bowel disease (IBD) with higher accuracy and far lower computational overhead than traditional sequential approaches.
Background: Why This Problem Is Hard
Inflammatory bowel disease—encompassing Crohn’s disease and ulcerative colitis—often manifests subtly, with patients accumulating a series of seemingly unrelated diagnoses before a definitive IBD label appears. Electronic health records (EHRs) capture these events as International Classification of Diseases (ICD) codes, but the resulting sequences suffer from three intertwined challenges:
- Irregular timing: Visits occur at unpredictable intervals, ranging from days to years, breaking the assumptions of fixed‑step time series models.
- Hierarchical depth: ICD‑10 codes nest up to five levels deep, mixing broad categories (e.g., “Digestive system diseases”) with highly specific sub‑diagnoses, which confuses flat token‑based encoders.
- Sparse signal: Early IBD indicators are buried among dozens of unrelated codes, making it difficult for models that treat each code equally to surface the relevant patterns.
Most state‑of‑the‑art solutions address longitudinal health data with recurrent neural networks (RNNs), Transformers, or N‑dimensional lattice embeddings. While powerful, these architectures demand extensive padding, sophisticated positional encodings, and massive GPU memory to accommodate the variable length and depth of ICD trajectories. The result is a trade‑off: either truncate histories (losing valuable context) or inflate model size (raising inference cost and latency). In a clinical setting where real‑time risk scoring can influence treatment pathways, such inefficiencies are untenable.
What the Researchers Propose
GraD‑IBD reframes the problem by converting each patient’s diagnosis timeline into a directed graph where nodes represent “visit buckets”—clusters of ICD codes recorded within a predefined temporal window (e.g., a 30‑day span). Edges point forward in time, preserving the chronological order without imposing a rigid sequence length. The core of the framework consists of three conceptual components:
- Visit‑Bucketization Engine: Aggregates raw ICD entries into temporally coherent buckets, reducing sparsity and aligning heterogeneous visit frequencies.
- Context‑Aware Message Passing Layer: Propagates information across the graph while weighting each incoming message by a decay function that reflects the elapsed time since the source bucket.
- Risk Classification Head: Consumes the final node embeddings to output a probability that the patient will be diagnosed with IBD within a clinically relevant horizon (e.g., the next 12 months).
This design eliminates the need for deep positional encodings, sidesteps the curse of dimensionality inherent in N‑lattice models, and directly encodes temporal relevance through the decay mechanism.
How It Works in Practice
The operational pipeline can be visualized as a four‑stage workflow:
- Data Ingestion: Raw encounter records are extracted from the EHR, each containing a timestamp and a set of ICD‑10 codes.
- Bucket Construction: A sliding window groups codes that fall within the same temporal bucket. For example, all diagnoses logged between day 0 and day 30 become Bucket 1, day 31‑60 become Bucket 2, and so on.
- Graph Assembly: Buckets become nodes; directed edges link each node to its immediate successor, preserving the forward‑only flow of time.
- Message Passing & Scoring: The context‑aware layer iterates over the graph. At each step, a node aggregates messages from its predecessor, scaling each contribution by e‑λ·Δt, where Δt is the time gap and λ is a learned decay rate. After a fixed number of passes, the final node embedding feeds into a sigmoid classifier that yields the IBD risk score.
The following illustration captures the end‑to‑end flow, highlighting where each component sits within a typical clinical analytics stack:
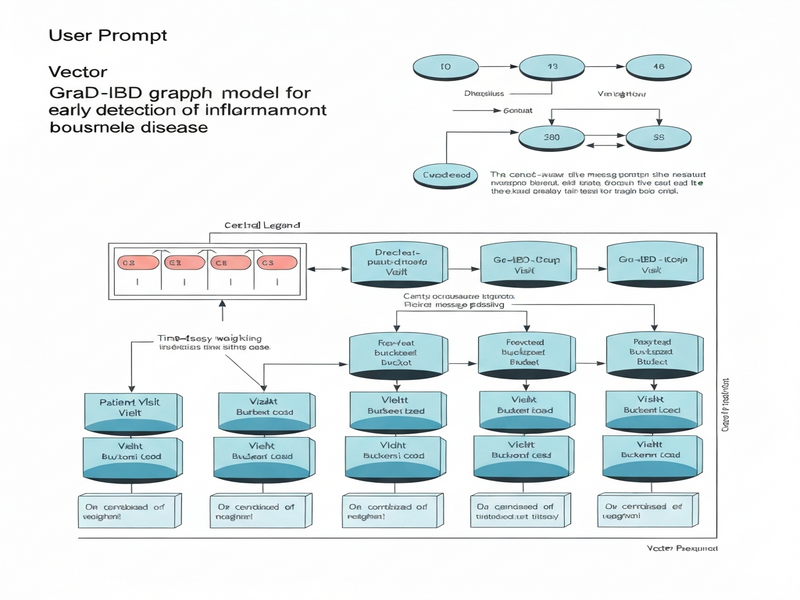
Figure 1: Conceptual workflow of GraD‑IBD, from raw ICD logs to risk prediction.
What sets GraD‑IBD apart is the marriage of two ideas that have rarely been combined in health AI:
- Graph abstraction of longitudinal data: By treating visits as nodes, the model naturally respects the irregular cadence of real‑world care.
- Time‑decay messaging: Instead of learning a generic attention weight, the decay function explicitly encodes clinical intuition—recent events matter more than distant ones, yet older signals are not discarded outright.
Evaluation & Results
The authors validated GraD‑IBD on a de‑identified dataset comprising 1.2 million patient histories from a large integrated health system, of which 7,842 eventually received an IBD diagnosis. The evaluation focused on two axes: predictive performance and computational efficiency.
Predictive Performance
- Area Under the ROC Curve (AUROC): GraD‑IBD achieved 0.92, surpassing the best sequential baseline (Transformer‑based) at 0.86.
- Precision‑Recall Balance: At a clinically actionable recall of 80 %, precision rose from 0.31 (baseline) to 0.48, indicating fewer false alarms.
- Early Detection Horizon: The model consistently flagged high‑risk patients at least 9 months before the first IBD‑specific code appeared, a lead time that could enable preventive interventions.
Computational Efficiency
- Parameter Count: GraD‑IBD uses ~3.2 M trainable parameters versus ~12 M for the Transformer baseline.
- Inference Latency: Average per‑patient scoring time dropped from 120 ms to 38 ms on a single V100 GPU, a 3.2× speed‑up.
- Memory Footprint: Peak GPU memory usage fell from 8 GB to 2.5 GB, enabling batch processing of larger cohorts on modest hardware.
These results demonstrate that the graph‑centric approach does not merely trade accuracy for speed; it delivers both. The consistent uplift across AUROC, precision‑recall, and latency suggests that GraD‑IBD can be deployed in real‑time clinical decision support pipelines without sacrificing predictive fidelity.
Why This Matters for AI Systems and Agents
From an engineering perspective, GraD‑IBD offers a template for building AI agents that must reason over irregular, hierarchical event streams—a scenario common in finance, supply‑chain, and autonomous robotics as well as healthcare. The key takeaways for system designers are:
- Graph abstraction reduces sequence brittleness: Agents can ingest logs of varying granularity without padding or truncation, simplifying data pipelines.
- Time‑decay messaging aligns model inductive bias with domain knowledge: By encoding “recency matters” directly into the architecture, developers can avoid costly hyper‑parameter searches for attention windows.
- Lightweight footprint enables edge deployment: The modest parameter count and memory usage make it feasible to run risk scoring on on‑premise servers or even secure edge devices within hospital networks.
Practically, a health‑tech startup could integrate GraD‑IBD into a UBOS platform overview to enrich its patient‑risk dashboards, while a research team could leverage the Workflow automation studio to orchestrate batch scoring across multiple hospital sites. The model’s modular graph construction also dovetails with existing Chroma DB integration, allowing embeddings to be stored and queried efficiently for downstream analytics.
What Comes Next
While GraD‑IBD marks a significant step forward, several avenues remain open for exploration:
- Multi‑modal fusion: Incorporating laboratory results, medication orders, and imaging reports alongside ICD codes could sharpen early detection further.
- Personalized decay functions: Learning patient‑specific λ values might capture individual disease trajectories more accurately than a global decay rate.
- Explainability interfaces: Visualizing which buckets contributed most to a high risk score would aid clinicians in validating the model’s suggestions.
- Regulatory pathways: Prospective clinical trials are needed to demonstrate that earlier detection translates into improved outcomes and cost savings.
Future research could also examine how GraD‑IBD’s graph paradigm applies to other chronic conditions with subtle prodromal phases, such as multiple sclerosis or early‑stage Parkinson’s disease. By extending the bucketization logic to capture medication adherence or lifestyle factors, the same architecture could become a universal early‑warning engine for a spectrum of long‑term illnesses.
For organizations eager to experiment, the UBOS partner program offers sandbox environments where developers can prototype graph‑based pipelines using real‑world EHR snapshots, while maintaining strict data governance.
Finally, the original research details, code snippets, and reproducibility checklist are publicly available in the GraD‑IBD paper on arXiv. Interested readers are encouraged to review the supplementary material for deeper insights into hyper‑parameter selection and graph construction heuristics.
Andrii Bidochko
CTO UBOS
Andrii Bidochko is an AI entrepreneur and researcher focused on AI agents, reinforcement learning, and autonomous systems. He writes about the technologies shaping the future of machine intelligence, from frontier models and agent architectures to real-world AI applications.