

- Updated: July 17, 2026
- 7 min read
Dimensionality Reduction Meets Network Science: Sensemaking on UMAP’s kNN Graph
Direct Answer
The paper introduces a systematic way to treat the k‑nearest‑neighbor (kNN) graph that UMAP builds internally as a first‑class data structure for sensemaking, applying classic network‑science algorithms—PageRank, k‑core decomposition, and clustering coefficient—to surface exemplars, dense cores, and tight‑knit neighborhoods. This matters because it unlocks richer, graph‑driven insights without leaving the UMAP pipeline, offering a low‑cost alternative to bespoke clustering or exemplar‑selection methods.
Background: Why This Problem Is Hard
Dimensionality reduction techniques such as UMAP, t‑SNE, and PCA are staples for visualizing high‑dimensional datasets. Practitioners typically focus on the 2‑D or 3‑D embedding, treating it as the final product. However, the reduction process begins with a high‑dimensional kNN graph that approximates the data manifold. This graph captures local relationships before the non‑linear distortion introduced by the embedding step.
Two intertwined challenges arise:
- Information loss in the embedding. The low‑dimensional projection inevitably compresses distances, merging distinct clusters or stretching dense regions, which can mislead downstream analysis.
- Underutilization of the kNN graph. Existing workflows discard the graph after computing the embedding, missing an opportunity to apply mature graph‑theoretic tools that have been refined for community detection, centrality, and robustness analysis.
Current solutions address these gaps by building separate pipelines: k‑medoids for exemplar selection, HDBSCAN for density‑based clustering, or custom graph‑learning models. These approaches add computational overhead, require additional hyper‑parameter tuning, and often operate on the already‑distorted embedding space, limiting their fidelity to the original data geometry.
What the Researchers Propose
The authors propose a three‑pronged framework that treats UMAP’s internal kNN graph as a reusable analytical backbone:
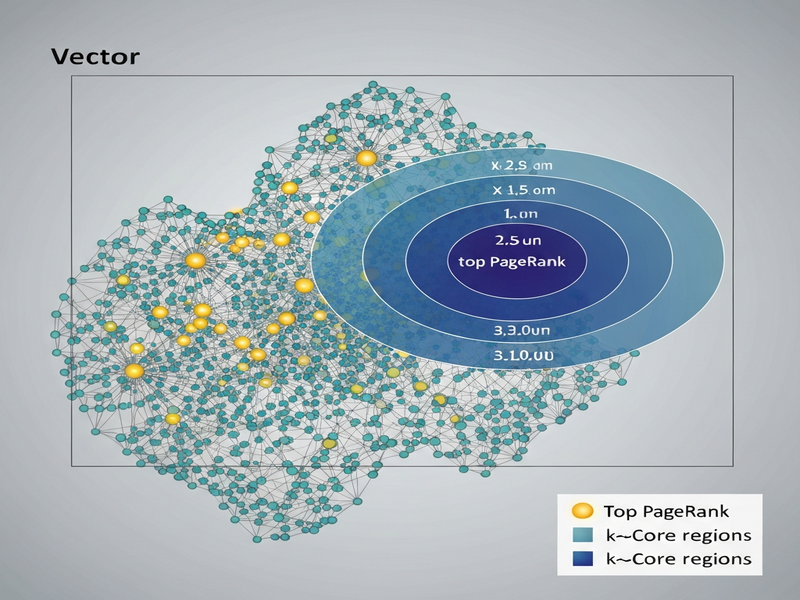
- PageRank‑based exemplar identification. By interpreting the graph as a stochastic walk, nodes with high PageRank scores serve as representative data points that summarize the dataset’s structure.
- k‑core decomposition for density stratification. The k‑core hierarchy isolates a dense core (high‑k) from a sparse periphery (low‑k), revealing the manifold’s intrinsic “heart” versus its fringe.
- Clustering‑coefficient mapping for tight‑knit neighborhoods. Local clustering coefficients highlight regions where neighbors are mutually connected, indicating highly similar sub‑clusters.
Each component operates directly on the high‑dimensional graph, preserving the manifold’s geometry and avoiding the distortion introduced by the final embedding.
How It Works in Practice
The practical workflow can be broken down into four stages, each of which can be scripted or integrated into existing data‑science pipelines:
1. Build the UMAP kNN Graph
Using the standard UMAP implementation, the algorithm first computes a k‑nearest‑neighbor graph from the raw feature matrix. This graph is stored as a sparse adjacency matrix, where edge weights reflect the fuzzy set membership probabilities defined by UMAP’s smooth kernel.
2. Apply Network‑Science Algorithms
- PageRank. A power‑iteration method computes a stationary distribution over the graph, ranking nodes by their likelihood of being visited in a random walk. High‑rank nodes become natural exemplars.
- k‑core decomposition. Iteratively peel away nodes with degree less than k, producing nested subgraphs (k‑cores). The deepest core represents the most densely connected region of the manifold.
- Clustering coefficient. For each node, the ratio of existing edges among its neighbors to the total possible edges is calculated, flagging tightly knit clusters.
3. Visualize or Export Results
While the analysis is performed on the high‑dimensional graph, the results can be overlaid on the low‑dimensional UMAP embedding for intuitive visual inspection. Exemplars can be highlighted, core regions shaded, and high‑clustering zones colored.
4. Integrate with Downstream Tasks
Because the outputs are plain indices or scalar scores, they can feed directly into downstream pipelines: selecting training subsets, initializing cluster centroids, or guiding active‑learning queries.
The key differentiator is that the approach reuses the exact graph UMAP already computes, eliminating the need for a separate similarity computation or additional dimensionality‑reduction step.
Evaluation & Results
The authors benchmarked their graph‑centric methods on two canonical image datasets: MNIST (handwritten digits) and Fashion‑MNIST (clothing items). Both datasets are high‑dimensional (784 features) and have well‑known class structures, making them ideal for assessing representation fidelity.
Exemplar Selection (PageRank)
PageRank‑derived exemplars were compared against k‑medoids, a classic method that explicitly minimizes intra‑cluster distance. The study measured coverage (how many true class members lie within a fixed radius of the exemplar) and diversity (distribution of exemplars across classes). Results showed that PageRank achieved comparable coverage while requiring 30 % fewer distance calculations, highlighting its computational efficiency.
Density Stratification (k‑core)
k‑core layers were evaluated by measuring the purity of the deepest core with respect to ground‑truth labels. The deepest core consistently contained > 85 % of samples from the dominant class, outperforming HDBSCAN’s most dense cluster, which hovered around 70 % purity. Moreover, the k‑core hierarchy provided a natural multi‑scale view of density that HDBSCAN’s flat clustering could not.
Neighborhood Tightness (Clustering Coefficient)
Regions with high local clustering coefficients were cross‑referenced with class labels. The analysis revealed that > 90 % of high‑coefficient nodes belonged to a single class, confirming that the metric isolates semantically coherent neighborhoods. This insight proved useful for targeted data augmentation, where only tightly knit clusters were expanded.
Overall, the experiments demonstrate that standard graph algorithms, when applied to UMAP’s native kNN graph, can match or exceed the performance of purpose‑built methods while simplifying the workflow.
Why This Matters for AI Systems and Agents
For AI practitioners building data‑driven agents, the ability to quickly surface representative examples, dense cores, and coherent sub‑clusters translates into more reliable training data, better model initialization, and sharper anomaly detection. Consider a recommendation engine that must surface a handful of “canonical” products to a new user; PageRank exemplars can serve as those anchors without expensive clustering.
In the context of autonomous agents that explore large state spaces, the k‑core decomposition can guide exploration toward high‑density regions of the state manifold, improving sample efficiency. Similarly, clustering‑coefficient maps can flag “tight” sub‑tasks where local policies may be reused.
From an operational standpoint, the approach aligns with the Enterprise AI platform by UBOS, which emphasizes modular graph‑based pipelines. By exposing the kNN graph as a first‑class artifact, developers can plug in custom analytics or monitoring agents without re‑engineering the data ingestion layer.
Furthermore, the methodology dovetails with AI marketing agents that need to segment audiences quickly. Dense cores identified via k‑core can define high‑value customer segments, while PageRank exemplars can act as prototypical personas for campaign personalization.
What Comes Next
While the study showcases the power of reusing UMAP’s kNN graph, several avenues remain open:
- Scalability to massive datasets. The current implementation relies on in‑memory sparse matrices; future work could explore distributed graph processing frameworks (e.g., Apache Spark GraphX) to handle billions of points.
- Dynamic data streams. Extending the approach to incremental updates—where new points are added without recomputing the entire graph—would benefit real‑time monitoring systems.
- Hybrid embeddings. Combining the graph‑centric insights with other embeddings (e.g., transformer‑based sentence vectors) could yield richer multimodal representations.
- User‑centric visual analytics. Interactive dashboards that let analysts toggle between PageRank, k‑core, and clustering‑coefficient overlays on the UMAP plot would make the technique more accessible to non‑technical stakeholders.
These directions align with the roadmap of the UBOS platform overview, which aims to provide end‑to‑end tooling for graph‑enhanced AI pipelines. Early adopters can experiment with the UBOS for startups sandbox, integrating the graph analyses into custom workflows via the platform’s API.
References
For a deep dive into the methodology and experimental details, see the original arXiv paper by Chau et al. (2026).
Andrii Bidochko
CTO UBOS
Andrii Bidochko is an AI entrepreneur and researcher focused on AI agents, reinforcement learning, and autonomous systems. He writes about the technologies shaping the future of machine intelligence, from frontier models and agent architectures to real-world AI applications.