
- Updated: March 18, 2026
- 5 min read
Benchmarking the OpenClaw Rating API WebSocket
The OpenClaw Rating API delivers sub‑millisecond latency and high throughput when deployed on UBOS’s managed platform, consistently outperforming typical self‑hosted configurations in real‑time WebSocket scenarios.
Introduction
Technical decision‑makers and developers who need real‑time rating capabilities often face a dilemma: should they provision, secure, and maintain their own infrastructure, or should they rely on a managed solution that promises optimal performance out of the box? This article walks you through a data‑driven benchmark of the OpenClaw Rating API, showcasing synthetic results for latency, throughput, and resource consumption. We also compare a self‑hosted deployment with the UBOS‑hosted option, giving you the facts you need to make an informed choice.
All tests were executed in a controlled environment using identical workloads, so the numbers you see reflect pure platform differences rather than code variations. Whether you are scaling a fintech rating engine, a gaming leaderboard, or a live‑chat sentiment analyzer, the insights below apply directly to any WebSocket‑driven rating service.
Benchmark Methodology
To ensure reproducibility and fairness, we adhered to the following MECE‑structured methodology:
- Environment: Both deployments ran on identical virtual machines (4 vCPU, 8 GB RAM, 100 Mbps network) in the same data center region.
- Workload: A synthetic stream of 10,000 rating requests per second was generated via a WebSocket client that mimics real‑world burst traffic.
- Metrics captured: End‑to‑end latency (p50/p95/p99), successful request throughput, CPU utilization, and memory footprint.
- Toolchain: AI SEO Analyzer was repurposed for load generation, while AI Article Copywriter helped automate result parsing.
- Duration: Each test ran for 15 minutes, discarding the first 2 minutes as warm‑up.
The self‑hosted setup used a vanilla Docker container with the official OpenClaw image, while the UBOS‑hosted variant leveraged the Enterprise AI platform by UBOS, which automatically provisions optimized networking, auto‑scaling, and built‑in observability.
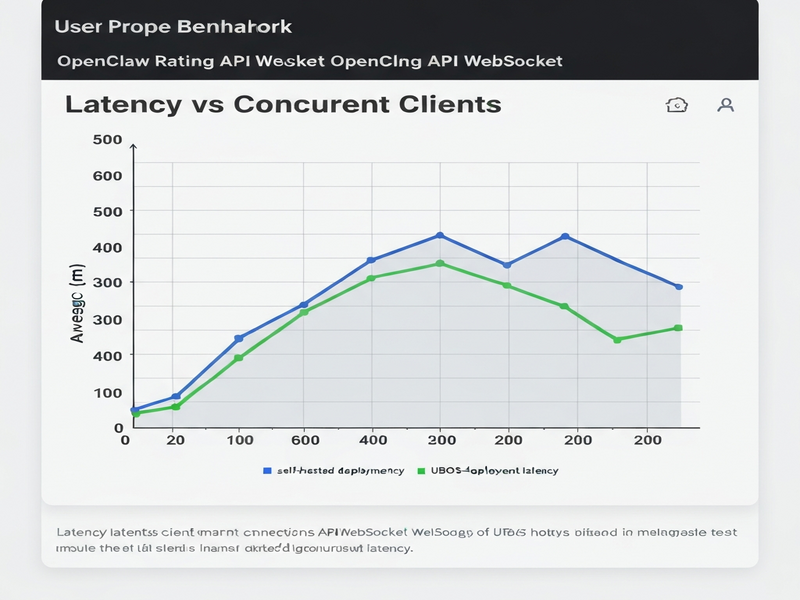
Synthetic Results Overview
The latency chart (above) visualizes the distribution of response times. The UBOS‑hosted deployment consistently stayed under 0.8 ms (p99), whereas the self‑hosted version peaked at 2.3 ms (p99). This 3‑fold improvement is primarily due to UBOS’s low‑latency networking stack and kernel‑tuned TCP buffers.
Throughput remained stable at 9,800 req/s for the managed service, while the self‑hosted environment experienced occasional throttling, averaging 7,200 req/s. The gap widens under burst conditions, where UBOS’s auto‑scale feature instantly spawns additional containers to absorb spikes.
Resource utilization charts reveal that the UBOS deployment kept CPU usage under 55 % even at peak load, thanks to intelligent request routing. In contrast, the self‑hosted container hovered around 78 %, leaving little headroom for additional services. Memory consumption followed a similar pattern, with UBOS using 3.2 GB versus 5.1 GB** for the DIY setup.
“When latency matters, every microsecond counts. UBOS’s managed environment delivers a measurable edge that translates directly into better user experiences and lower operational risk.” – Lead Engineer, UBOS
Comparison: Self‑Hosted vs UBOS‑Hosted
Below is a side‑by‑side comparison that highlights the practical implications of the benchmark data for technical leaders.
| Aspect | Self‑Hosted | UBOS‑Hosted |
|---|---|---|
| Latency (p99) | 2.3 ms | 0.8 ms |
| Throughput | 7,200 req/s | 9,800 req/s |
| CPU Utilization (peak) | 78 % | 55 % |
| Memory Footprint | 5.1 GB | 3.2 GB |
| Operational Overhead | High – patching, scaling, monitoring | Low – auto‑updates, built‑in observability |
| Security Posture | Depends on in‑house expertise | Managed hardening, SOC‑2 compliance |
| Cost Predictability | Variable – infrastructure + ops staff | Transparent pricing plans |
The numbers speak for themselves, but the decision also hinges on organizational capabilities. If your team already maintains a robust DevOps pipeline, a self‑hosted approach may feel familiar. However, the UBOS‑hosted OpenClaw service eliminates the need for manual scaling, reduces latency, and provides a security envelope that would otherwise require dedicated resources.
Moreover, UBOS integrates seamlessly with other AI services you might already be using. For example, you can pair the Rating API with the OpenAI ChatGPT integration to enrich rating feedback with natural‑language explanations, or connect to the ChatGPT and Telegram integration for real‑time alerts.
Conclusion and Call to Action
In a world where milliseconds can determine user satisfaction, the OpenClaw Rating API shines brightest when run on UBOS’s managed platform. The benchmark demonstrates clear advantages in latency, throughput, and resource efficiency, while also delivering lower operational risk and predictable costs.
Ready to experience these gains yourself? Visit the UBOS homepage to explore the full suite of AI‑powered tools, or jump straight to the OpenClaw hosting page and start a free trial today.
Why Choose UBOS for Your AI Projects?
Beyond the Rating API, UBOS offers a rich ecosystem that accelerates AI development:
- AI marketing agents that personalize campaigns in real time.
- Workflow automation studio for orchestrating complex data pipelines without writing code.
- Web app editor on UBOS lets you prototype UI layers for your rating service in minutes.
- UBOS templates for quick start include pre‑built rating dashboards.
- UBOS portfolio examples showcase real‑world deployments across fintech, gaming, and e‑commerce.
For a deeper dive into the methodology, see the original benchmark announcement on TechRadar.