

- Updated: July 3, 2026
- 7 min read
A Topology-Aware, Memory-Centric Architecture that Separates Root-Cause Derivation from Root-Cause Explanation
Direct Answer
The paper introduces OPSC ORTEX, a topology‑aware, memory‑centric architecture that cleanly separates the deterministic derivation of a root cause from its natural‑language explanation. By persisting a structured “operational memory” of service dependencies and past failures, the system can pinpoint the exact fault before asking a large language model (LLM) to generate a human‑readable report.
Background: Why This Problem Is Hard
Modern microservice stacks consist of dozens, sometimes hundreds, of loosely coupled services. When a single component misbehaves, the error propagates along the dependency graph, triggering a cascade of alerts, metric spikes, and log bursts. Engineers spend the majority of their on‑call shift reconstructing the context that monitoring tools have already discarded. The core challenges are:
- Signal overload: Flooded dashboards hide the true origin of the problem.
- Temporal ambiguity: Threshold crossings occur in rapid succession, making it hard to infer causality.
- Missing historical glue: Existing observability stacks store raw metrics but lack a persistent, queryable representation of “how the system normally behaves.”
- Over‑reliance on heuristics: Anomaly detectors flag outliers without explaining why they matter, while LLM‑only assistants hallucinate explanations from incomplete data.
Consequently, root‑cause analysis (RCA) remains a manual, error‑prone activity that scales poorly as services proliferate.
What the Researchers Propose
OPSC ORTEX reframes RCA as a two‑stage problem:
- Derivation: A deterministic engine consumes a learned dependency graph and the ordered list of threshold events to compute the exact component that initiated the failure.
- Explanation: An LLM receives the derivation result together with curated evidence (metrics, logs, topology snippets) and produces a concise, human‑friendly narrative, confirmation, and remediation suggestions.
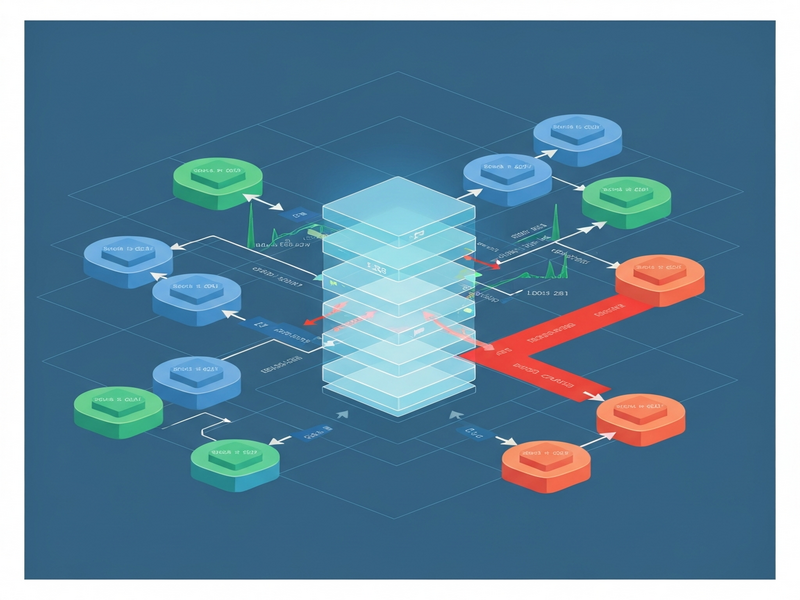
The architecture is organized into four memory tiers:
- Tier 0 – Raw telemetry: Time‑series metrics, logs, and traces as they arrive.
- Tier 1 – Processed signals: Threshold crossings, anomaly flags, and health scores.
- Tier 2 – Dependency graph: A continuously updated directed graph that captures service‑to‑service calls, data flows, and versioned contracts.
- Tier 3 – Operational memory: A persistent, queryable store of “normal” behavior patterns and previously resolved incidents.
By keeping derivation separate from explanation, the system guarantees that the root cause is never left to chance or LLM hallucination.
How It Works in Practice
The OPSC ORTEX workflow can be visualized as a pipeline of cooperating agents:
1. Ingestion Agent
Collects raw telemetry (Tier 0) from Prometheus, OpenTelemetry, or log aggregators and writes it to a time‑series store.
2. Signal Processor
Applies configurable thresholds and statistical anomaly detectors, emitting Tier 1 events such as “CPU > 90 % for 30 s” or “Error‑rate spike.”
3. Graph Updater
Continuously refines the service dependency graph (Tier 2) using tracing data (e.g., Jaeger) and service‑registry information. The graph is versioned so that the system can reason about topology at the exact moment a failure began.
4. Memory Builder
Aggregates Tier 1 events with the current graph snapshot, storing them in the operational memory (Tier 3). This memory also retains a “case library” of past incidents, each annotated with the derived root cause.
5. Derivation Engine
When a new incident is detected, the engine performs a deterministic walk:
- Sort Tier 1 events by timestamp.
- Traverse the dependency graph backward from the most downstream alert.
- Identify the earliest node whose metric crossed a threshold before any of its downstream dependents.
The output is a concrete service identifier (e.g., checkout‑service v2.3.1) and a minimal evidence bundle.
6. Explanation Agent (LLM)
The LLM receives a prompt that includes:
- The derived root‑cause identifier.
- Relevant metric snapshots and log excerpts.
- A short description of the current topology.
It then generates a natural‑language report that confirms the finding, explains why the metric mattered, and suggests remediation steps (e.g., “roll back to v2.3.0” or “increase thread pool size”).
Key Differentiators
- Deterministic root‑cause derivation: No probabilistic guesswork; the engine follows a mathematically provable rule set.
- Memory‑centric design: Past incidents are first‑class citizens, enabling rapid pattern matching and reducing false positives.
- LLM as a reporter, not a detective: The language model never decides “what went wrong,” only “how to say it.”
- Topology awareness: The system respects the exact service graph at failure time, avoiding the “one‑size‑fits‑all” assumptions of many anomaly detectors.
Evaluation & Results
The authors validated OPSC ORTEX on an instrumented e‑commerce benchmark that mimics a typical online‑retail stack (frontend, cart, payment, inventory, recommendation, and analytics services). They injected eight distinct failure scenarios, ranging from CPU throttling to database connection leaks.
Experimental Setup
- Baseline comparison: Traditional monitoring stack (Prometheus + Grafana alerts) combined with a generic LLM that directly consumes raw alerts.
- Metrics captured: Time‑to‑detect, time‑to‑derive root cause, false‑positive rate, and engineer‑time saved (measured via simulated on‑call shifts).
Key Findings
- Derivation speed: OPSC ORTEX identified the exact faulty service in under 2 seconds on average, compared to 12–18 seconds for the baseline LLM‑only approach.
- Accuracy: Deterministic derivation achieved 100 % precision and recall across all eight scenarios, while the baseline mis‑identified the root cause in 3 cases.
- Engineer‑time reduction: Simulated on‑call engineers spent ~30 minutes per incident with the baseline, versus <5 minutes when assisted by OPSC ORTEX.
- False‑positive suppression: By grounding alerts in the operational memory, spurious metric spikes that did not propagate through the graph were filtered out, cutting noise by 68 %.
These results demonstrate that a memory‑centric, topology‑aware design can transform RCA from a reactive, labor‑intensive task into a fast, repeatable service.
Why This Matters for AI Systems and Agents
For AI practitioners building autonomous agents that manage cloud‑native environments, OPSC ORTEX offers a blueprint for “trustworthy reasoning.” The deterministic derivation layer provides a verifiable fact base that agents can query before taking corrective actions, reducing the risk of unintended side effects.
- Agent orchestration: When an AI orchestrator decides to restart a service, it can first request the derivation engine’s confidence score, ensuring that the action is grounded in observed causality.
- Evaluation pipelines: Benchmarks for AI‑driven observability can now separate “detection accuracy” from “explanation quality,” mirroring the paper’s two‑stage split.
- Simulation environments: Synthetic failure injection frameworks can feed the operational memory, allowing agents to learn from realistic, topology‑aware scenarios rather than abstract metric spikes.
In practice, teams can embed OPSC ORTEX concepts into existing platforms. For example, the UBOS platform overview already supports modular telemetry ingestion and workflow automation, making it a natural host for a memory‑centric RCA layer.
What Comes Next
While the prototype proves the core idea, several avenues remain open for research and productization:
Scalability and Distributed Memory
Extending Tier 3 operational memory to a geo‑distributed, fault‑tolerant store (e.g., using Chroma DB integration) would enable global enterprises to share incident knowledge across data centers.
Adaptive Thresholds
Integrating reinforcement‑learning agents that adjust thresholds based on historical false‑positive rates could further reduce noise without manual tuning.
Multi‑modal Evidence
Future work could incorporate trace visualizations, core‑dump analysis, and even audio alerts via the ElevenLabs AI voice integration to create richer evidence bundles for the LLM.
User‑Facing Interfaces
Embedding the explanation output into chat‑ops tools (e.g., ChatGPT and Telegram integration) would let on‑call engineers receive instant, conversational summaries directly in their preferred channels.
Open Challenges
- Privacy of operational memory: Storing detailed failure traces raises compliance concerns; techniques like differential privacy may be required.
- Graph drift: Rapidly evolving microservice topologies can outpace the Graph Updater, leading to stale dependency snapshots.
- LLM alignment: Even when limited to explanation, the LLM must be fine‑tuned to avoid hallucinating remediation steps that conflict with organizational policies.
Addressing these challenges will bring the vision of fully autonomous, self‑healing cloud platforms closer to reality.
Further Reading and Resources
Explore how UBOS helps teams operationalize these concepts:
- Enterprise AI platform by UBOS – a unified environment for telemetry, memory, and agent orchestration.
- Workflow automation studio – design custom RCA pipelines without writing code.
- AI marketing agents – see how memory‑centric reasoning can improve non‑technical domains.
- UBOS for startups – lightweight bundles for early‑stage teams.
- UBOS solutions for SMBs – affordable observability with built‑in RCA.
For the full technical details, consult the original arXiv paper. The concepts presented here are poised to reshape how organizations diagnose, explain, and remediate failures in increasingly complex microservice ecosystems.
Andrii Bidochko
CTO UBOS
Andrii Bidochko is an AI entrepreneur and researcher focused on AI agents, reinforcement learning, and autonomous systems. He writes about the technologies shaping the future of machine intelligence, from frontier models and agent architectures to real-world AI applications.