
- Updated: June 26, 2026
- 7 min read
Human vs Machine Mathematical Difficulty on Project Euler: An Experimental Analysis
Direct Answer
The paper Human vs Machine Mathematical Difficulty on Project Euler (arXiv) introduces a large‑scale empirical study that compares how frontier AI models expend computational effort relative to human solve times on a curated set of Project Euler problems. Its key finding is that, contrary to earlier speculation, most state‑of‑the‑art models scale *better* than humans as problem difficulty rises, following a sub‑linear power‑law relationship.
Background: Why This Problem Is Hard
Project Euler is a well‑known repository of mathematically intensive programming challenges that require both algorithmic insight and efficient code. Because each problem is publicly annotated with the average time human solvers need to reach a correct answer, the platform offers a rare, quantifiable proxy for “difficulty” that can be compared across species of problem‑solvers.
Benchmarking AI systems on such problems is difficult for three reasons:
- Heterogeneous effort metrics. Traditional AI benchmarks (e.g., ImageNet, GLUE) report accuracy or latency, but they do not capture the monetary or token‑based cost of generating a solution.
- Non‑linear scaling. As problems become more intricate, the computational pathways that models explore can diverge dramatically, making it hard to predict whether larger models will become more efficient or simply more expensive.
- Lack of a common difficulty axis. Human solve time is an intuitive, community‑validated measure, yet few prior works have linked it to machine‑side cost in a systematic way.
Existing approaches either treat AI performance as a binary “solved / not solved” label or rely on synthetic difficulty estimators that do not reflect real‑world problem‑solving effort. This gap leaves AI developers without a clear yardstick for estimating the economic impact of deploying larger models on complex, reasoning‑heavy tasks.
What the Researchers Propose
The authors construct a benchmark called MathArena that records 3,840 attempts across 50 Project Euler problems using 26 distinct model configurations (including base, fine‑tuned, and instruction‑following variants). They then operationalize two simple, interpretable scaling hypotheses:
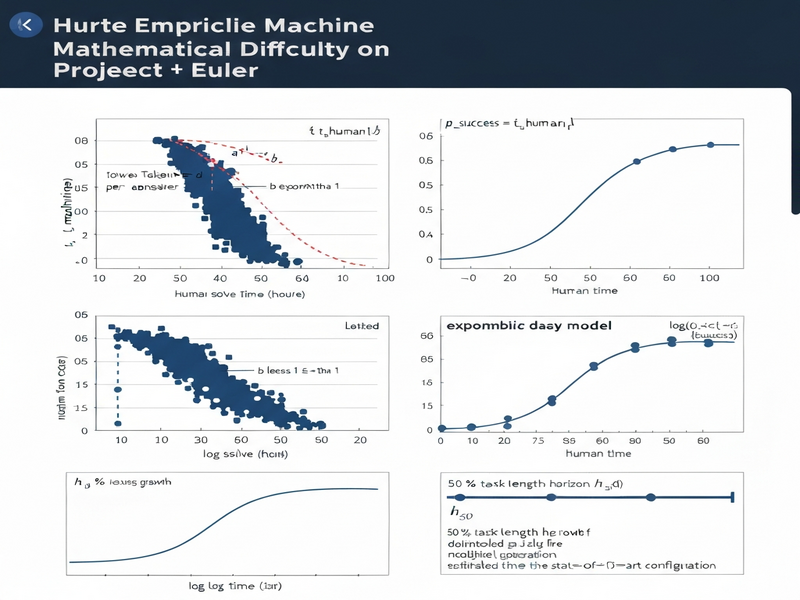
- Power‑law cost scaling. The token cost required for a model to produce a correct answer, tmachine, is hypothesized to follow tmachine = a·thumanb, where thuman is the publicly reported human solve time. A sub‑linear exponent (b < 1) would indicate that machines become relatively cheaper as difficulty grows.
- Exponential success decay. The probability of a model succeeding on a problem, psuccess, is modeled as psuccess = ec·t_human, implying a linear relationship between the logarithm of success probability and human time.
By fitting these models to the aggregated data, the researchers aim to answer two practical questions:
- Do larger, more capable models actually become more cost‑effective on harder mathematical tasks?
- Can a simple exponential curve reliably predict success rates across a spectrum of problem difficulties?
How It Works in Practice
Data Collection Pipeline
Each model configuration is prompted with the exact problem statement from Project Euler, along with a standard “solve this programmatically” instruction. The system records:
- The number of generated tokens until a correct answer is emitted.
- The wall‑clock time taken by the model (derived from token generation speed).
- A binary success flag based on a deterministic verifier that checks the numerical answer against the official solution.
All attempts are logged in a central repository, enabling batch analysis and reproducibility.
Modeling Workflow
The workflow follows a three‑stage pipeline:
- Pre‑processing. Human solve times are normalized and binned to reduce variance caused by outliers.
- Fit & validation. For each model, the researchers perform non‑linear regression to estimate the power‑law exponent b and the exponential decay constant c. They also compute logistic curves to extract a 50 % “task‑length horizon” (h50), the human time at which the model has a 50 % chance of success.
- Cross‑model comparison. Results are aggregated across the 26 configurations, allowing the authors to rank models by scaling efficiency and to observe trends over time (the snapshot is from 20 April 2026).
What Sets This Approach Apart
Unlike prior benchmarks that treat every problem as a binary classification, MathArena captures a continuous cost signal (token count) and ties it directly to a human‑centric difficulty metric. This dual‑axis view enables a nuanced discussion of “efficiency” that is meaningful for product teams budgeting compute resources.
Evaluation & Results
Scenario Coverage
The evaluation spans 50 problems ranging from introductory number‑theory puzzles (average human solve time ≈ 5 minutes) to deep combinatorial challenges (average human solve time > 4 hours). The 26 model configurations include:
- Base LLMs of varying parameter counts (7 B to 175 B).
- Instruction‑tuned variants (e.g., ChatGPT‑style prompts).
- Domain‑adapted models fine‑tuned on mathematical corpora.
Power‑Law Findings
For 20 of the 25 models that produced statistically usable fits, the exponent b was consistently below 1, ranging from 0.62 to 0.89. This sub‑linear scaling indicates that as human difficulty grows, the token cost for machines grows more slowly. Even the strongest base models (the 175 B parameter family) exhibited b ≈ 0.71, disproving the earlier hypothesis that “machines scale worse than humans on hard problems.”
Success Probability Modeling
When the data are aggregated into bins of similar human solve times, the log‑linear relationship between log(p_success) and thuman achieves a median R² of 0.92 across the 22 best‑covered configurations. This high explanatory power validates the exponential decay model for predicting success rates.
Logistic Horizon Insights
By fitting logistic curves, the authors extract a 50 % success horizon (h50) for each configuration. The top‑performing models in the April 2026 snapshot reach an h50 of roughly 2.5–4.3 hours on the “fastest‑five” human baseline (the five quickest problems). A log‑linear extrapolation across the frontier suggests a doubling time of about 75 days for the state‑of‑the‑art h50, implying rapid progress in solving increasingly difficult mathematical tasks.
Visual Summary
The figure below visualizes the power‑law fit for a representative 175 B model, overlaying human solve time on the x‑axis and token cost on the y‑axis. The sub‑linear slope is evident.
Why This Matters for AI Systems and Agents
Understanding how computational cost scales with problem difficulty has immediate, actionable implications for AI practitioners:
- Resource budgeting. Teams can forecast token consumption for new, harder tasks using the derived power‑law, avoiding costly over‑provisioning.
- Model selection. The sub‑linear exponent suggests that larger models may become more economical on the hardest problems, guiding decisions about when to upgrade from a 7 B to a 175 B model.
- Agent orchestration. Autonomous agents that dynamically allocate tasks to specialized models can use the exponential success curve to decide whether to attempt a problem or defer to a human operator.
- Benchmark design. MathArena demonstrates a template for future evaluation suites that blend human difficulty signals with machine cost metrics, encouraging more realistic performance reporting.
For organizations building AI‑driven products, these insights translate into concrete cost‑savings and faster time‑to‑market for features that rely on deep reasoning, such as automated theorem proving, financial risk modeling, or scientific discovery pipelines.
Explore how UBOS platform overview can help you integrate cost‑aware AI models into your workflow, or learn about Enterprise AI platform by UBOS for scaling reasoning‑heavy services.
What Comes Next
While the study provides compelling evidence for sub‑linear scaling, several limitations remain:
- Problem diversity. Project Euler focuses on pure mathematics; extending the benchmark to domains like symbolic physics or algorithmic optimization could test the generality of the scaling laws.
- Prompt engineering variance. The current protocol uses a single prompt template. Future work should explore how prompt complexity interacts with scaling behavior.
- Hardware heterogeneity. Token cost is a proxy for compute, but actual wall‑clock time varies with hardware. Normalizing across GPUs, TPUs, and specialized inference chips would sharpen cost predictions.
Potential research directions include:
- Developing a “difficulty‑aware scheduler” that routes tasks to the most cost‑effective model based on real‑time estimates of thuman.
- Integrating MathArena‑style metrics into continuous evaluation pipelines for large‑scale model training.
- Combining the exponential success model with reinforcement learning to let agents self‑adjust their confidence thresholds.
Practitioners interested in building such systems can start by leveraging the Workflow automation studio to prototype difficulty‑aware pipelines, or experiment with the OpenAI ChatGPT integration for rapid prototyping of reasoning agents.
As AI models continue to grow, the ability to predict both success likelihood and computational expense will become a cornerstone of responsible, scalable AI deployment.
— Published on the UBOS blog.