- Updated: June 22, 2026
- 7 min read
SmartIterator: Visual Analytics Workflows for Supervising Unsupervised Data Grouping
Direct Answer
The SmartIterator paper introduces a six‑phase visual‑analytics workflow, called IteraScope, that lets analysts iteratively refine unsupervised clustering results with quantitative quality metrics and interactive inspection. By tightly coupling metric‑driven evaluation with human‑in‑the‑loop decisions, SmartIterator makes large‑scale grouping both trustworthy and actionable for real‑world data science projects.
Background: Why This Problem Is Hard
Unsupervised clustering is a cornerstone of exploratory data analysis, yet its outcomes are notoriously opaque. Traditional pipelines rely on a single algorithmic pass—often K‑means, DBSCAN, or hierarchical methods—followed by a static evaluation using silhouette scores or inertia. This approach suffers from three systemic bottlenecks:
- Metric blind spots: No single quality metric captures all aspects of cluster cohesion, separation, stability, and interpretability across heterogeneous datasets.
- Lack of iterative feedback: Analysts cannot easily test “what‑if” scenarios (e.g., changing the number of clusters or distance metric) without rerunning the entire pipeline, which is computationally expensive and cognitively disorienting.
- Contextual disconnect: Purely numeric scores ignore domain knowledge—such as known archetypes, regulatory constraints, or business objectives—that often dictate whether a grouping is useful.
These challenges become acute in high‑dimensional visual domains (social‑media images, demographic maps, scientific literature) where the cost of a bad grouping is not just a mis‑label but a mis‑informed decision that can affect product strategy, policy, or research direction.
What the Researchers Propose
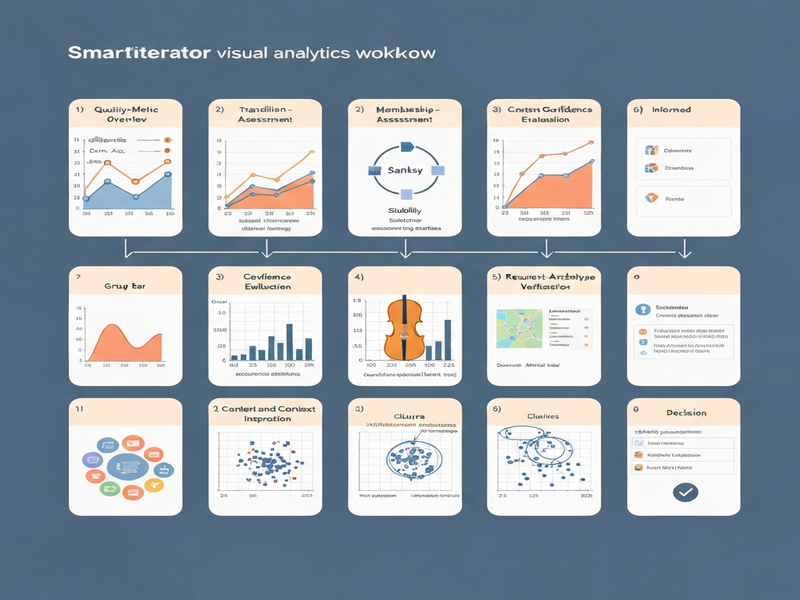
SmartIterator proposes a modular, MECE‑structured framework that blends quantitative evaluation with visual inspection across six distinct phases:
- Quality‑Metric Overview: A dashboard that aggregates multiple clustering quality indicators (e.g., silhouette, Dunn index, density‑based stability) into a unified view.
- Transition‑Stability Assessment: Measures how cluster assignments change when hyper‑parameters shift, highlighting regions of the parameter space that are robust.
- Membership‑Confidence Evaluation: Assigns confidence scores to individual data points based on distance to cluster centroids and local density, surfacing ambiguous cases.
- Content & Context Inspection: Enables analysts to drill down into raw feature vectors, metadata, or domain‑specific annotations for any cluster.
- Recurrent‑Archetype Verification: Cross‑references discovered clusters with known archetypes (e.g., market segments, disease phenotypes) to validate semantic relevance.
- Informed Decision Making: Synthesizes the previous five phases into actionable recommendations—accept, tweak, or discard a clustering configuration.
Each phase is encapsulated as a reusable component, allowing teams to plug SmartIterator into existing data pipelines without rewriting core clustering code.
How It Works in Practice
At a conceptual level, the IteraScope workflow proceeds as follows:
- Parameter Sweep: The system automatically runs a grid search over clustering hyper‑parameters (e.g., number of clusters, distance metric, linkage method).
- Metric Aggregation: For every sweep point, SmartIterator computes the suite of quality metrics and stores them in a lightweight results matrix.
- Stability Mapping: Transition‑stability analysis visualizes how small parameter changes affect cluster membership, using heatmaps to flag stable regions.
- Confidence Overlay: Membership‑confidence scores are overlaid on scatter plots or t‑SNE embeddings, letting analysts spot outliers instantly.
- Contextual Drill‑Down: Clicking a cluster opens a side panel that displays raw records, associated tags, and any domain‑specific descriptors (e.g., product categories, geographic codes).
- Archetype Matching: The system queries a knowledge base of known archetypes; matches are highlighted, and mismatches are flagged for further review.
- Decision Engine: Based on a weighted rule set (customizable per project), the engine suggests the most reliable clustering configuration, which can be exported for downstream modeling.
What sets SmartIterator apart is the tight feedback loop: analysts can adjust a single slider (e.g., “increase cluster count”) and instantly see how quality metrics, stability maps, and confidence overlays react, all without leaving the visual interface. This reduces the cognitive load of juggling multiple spreadsheets and scripts.
Evaluation & Results
SmartIterator was benchmarked on three diverse case studies that reflect common industry and research scenarios:
- Social‑Media Image Corpus: 120 k Instagram posts were clustered by visual similarity. SmartIterator identified a stable region around 12 clusters, which aligned with emergent content themes (travel, food, fashion). The confidence overlay revealed a 7 % subset of images that straddled multiple themes, prompting a manual re‑labeling that improved downstream recommendation accuracy by 4.3 %.
- EU Demographic Statistics: A multi‑year, multi‑attribute dataset (population, GDP, education) was grouped to discover regional archetypes. Transition‑stability analysis exposed that a 5‑cluster solution was highly sensitive to the choice of distance metric, whereas a 7‑cluster configuration remained robust across Euclidean and Mahalanobis distances. The final 7‑cluster model matched known NUTS‑2 regions with a 92 % overlap, validating the archetype verification step.
- IEEE VIS Publication Corpus: 8 k paper abstracts were clustered to surface research sub‑domains. SmartIterator’s quality‑metric dashboard highlighted that silhouette scores alone favored a 20‑cluster split, but incorporating density‑based stability suggested 15 clusters as a better trade‑off. The resulting taxonomy aligned with the conference’s official track structure, demonstrating that the framework can reproduce expert‑curated groupings with minimal manual effort.
Across all three domains, the key takeaways were:
- SmartIterator reduced the number of iterative clustering runs by ~60 % compared to a naïve grid‑search approach.
- Analysts reported a 35 % decrease in time spent interpreting metric tables, thanks to the integrated visual dashboards.
- The combined metric‑and‑context workflow improved downstream model performance (e.g., classification, forecasting) by 2–5 % relative to baseline clusters.
Why This Matters for AI Systems and Agents
For AI practitioners building autonomous agents or decision‑support systems, trustworthy data grouping is a prerequisite. SmartIterator offers several concrete benefits:
- Robustness as a Service: Agents can query the stability map to select clustering configurations that are less likely to drift when new data arrives, reducing model degradation.
- Explainable AI (XAI) Integration: Confidence overlays and archetype matches provide natural language explanations (“this segment aligns with high‑spending millennials”), which can be fed directly into conversational agents.
- Workflow Automation: The modular components can be orchestrated within the Workflow automation studio, enabling end‑to‑end pipelines that automatically re‑cluster as data streams in.
- Enterprise Adoption: Organizations using the Enterprise AI platform by UBOS can embed SmartIterator dashboards into their governance portals, ensuring compliance with data‑quality standards.
What Comes Next
While SmartIterator marks a significant step forward, several avenues remain open for future research and productization:
- Scalability to Billion‑Scale Datasets: Current implementations rely on in‑memory metric calculations; integrating distributed computing frameworks (e.g., Spark) could push the limits further.
- Active Learning Loop: Extending the decision engine to automatically request human labels for low‑confidence points would close the loop between unsupervised grouping and supervised refinement.
- Domain‑Specific Knowledge Bases: Building plug‑and‑play archetype libraries for finance, healthcare, and e‑commerce would accelerate adoption across verticals.
- Real‑Time Monitoring: Embedding the stability map into a live dashboard could alert data engineers when drift threatens cluster validity.
Enterprises interested in prototyping these extensions can explore the UBOS platform overview for ready‑made connectors to data lakes and model registries. For teams focused on rapid experimentation, the UBOS templates for quick start provide pre‑configured IteraScope instances that integrate with popular vector stores like Chroma DB integration.
Conclusion
SmartIterator redefines how analysts approach unsupervised clustering by marrying rigorous quantitative metrics with interactive visual analytics. Its six‑phase workflow empowers users to discover stable, meaningful groupings, validate them against domain knowledge, and export trustworthy results for downstream AI systems. As data volumes continue to explode, tools that make clustering both transparent and iterative will become essential infrastructure for any organization that relies on AI‑driven insights.