
- Updated: June 22, 2026
- 7 min read
Visualizing Latent Phase Structures in Locomotion Policies: A Multi-Environment Study with Temporal Feature Extension
Direct Answer
The paper introduces a novel framework for uncovering hidden locomotion phase structures directly from the trajectories generated by deep reinforcement‑learning (DRL) policies, extending clustering features with temporal information and a self‑transition‑aware cluster count estimator. This matters because it gives researchers and engineers a practical tool to visualize, diagnose, and improve complex locomotion controllers in MuJoCo environments such as Ant‑v5, HalfCheetah‑v5, and Walker2D‑v5.
Background: Why This Problem Is Hard
Locomotion control in robotics has long been modeled as a sequence of biomechanical phases—stance, swing, push‑off, etc. In classical control pipelines, engineers hand‑craft phase detectors using joint angles or ground‑reaction forces. Deep reinforcement learning, however, replaces these handcrafted pipelines with high‑dimensional neural policies that map raw observations to torques. While DRL policies achieve impressive performance on benchmarks, they become opaque black boxes:
- Hidden temporal patterns: The policy’s internal representation mixes state, action, and future dynamics, making it difficult to isolate recurring motion phases.
- Limited observability: Prior visualization methods rely solely on the current state vector, ignoring the rich information contained in actions and next‑state transitions.
- Cluster ambiguity: Traditional clustering algorithms often over‑segment or merge phases because they cannot automatically determine the appropriate number of clusters, leading to noisy phase diagrams.
These challenges hinder debugging, transfer learning, and safety verification for real‑world robots that must adhere to predictable gait cycles. As AI‑driven agents move from simulation to physical platforms, a systematic way to surface latent phase structures becomes a critical research bottleneck.
What the Researchers Propose
The authors present a three‑part framework designed to surface latent motion phases from any DRL locomotion policy:
- Temporal Feature Extension: Instead of clustering on raw state observations alone, the method augments each data point with the corresponding action, the next state, and the next action. This creates a richer “temporal fingerprint” that captures how the policy intends to move forward.
- Self‑Transition‑Suppressed Cluster Count Estimation: A novel heuristic evaluates candidate cluster numbers by penalizing clusters that predominantly transition to themselves. The optimal count minimizes self‑transitions, encouraging a more regular phase transition graph.
- Phase Transition Graph Construction: After clustering, the framework builds a directed graph where nodes represent discovered phases and edges encode observed transitions, revealing the underlying gait cycle.
Collectively, these components transform raw trajectory data into an interpretable phase diagram without requiring any prior biomechanical knowledge.
How It Works in Practice
The workflow can be broken down into four concrete steps that a robotics engineer can implement with standard Python data‑science stacks:
1. Data Collection from the Policy
The trained DRL policy interacts with the MuJoCo environment, generating a long trajectory of tuples (s_t, a_t, s_{t+1}, a_{t+1}). Because the policy is already deployed for evaluation, no extra instrumentation is needed.
2. Feature Augmentation
Each tuple is concatenated into a single high‑dimensional vector. The inclusion of a_t and a_{t+1} captures the controller’s intent, while s_{t+1} provides a glimpse of the immediate outcome, effectively embedding a short temporal window.
3. Adaptive Clustering
A standard clustering algorithm (e.g., K‑means or Gaussian Mixture Models) is run repeatedly for a range of cluster counts k. For each k, the algorithm computes the proportion of self‑transitions—instances where a point’s nearest neighbor belongs to the same cluster in the next time step. The k that yields the lowest self‑transition ratio is selected, ensuring that clusters correspond to distinct, temporally stable phases.
4. Phase Graph Extraction
With the optimal clustering in hand, the system scans the trajectory to count transitions between clusters, constructing a directed adjacency matrix. Visualizing this matrix as a graph reveals the regularity (or irregularity) of phase sequences, akin to a gait diagram used by biomechanists.
What sets this approach apart is the explicit use of future‑looking features (next state/action) and a data‑driven rule for choosing the number of phases, eliminating the need for manual tuning or domain‑specific heuristics.
Evaluation & Results
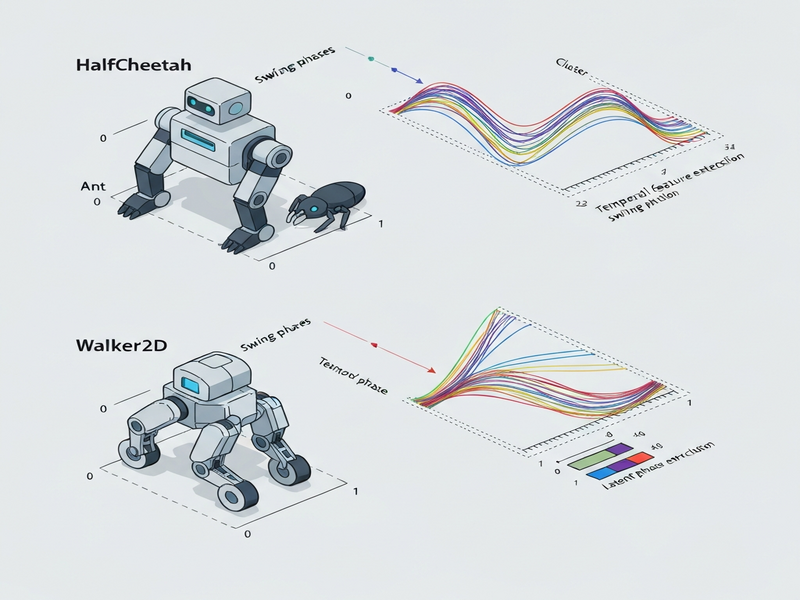
The authors validated the framework on three canonical MuJoCo benchmarks:
- Ant‑v5: A six‑legged robot with high‑dimensional joint space.
- HalfCheetah‑v5: A planar, fast‑running quadruped.
- Walker2D‑v5: A bipedal walker with a simple torso‑leg configuration.
For each environment, they compared three configurations:
- Baseline clustering on state observations only (the prior art).
- Temporal Feature Extension without self‑transition suppression.
- Full framework (temporal features + self‑transition‑aware cluster count).
The experiments demonstrated that the full framework consistently produced:
- Clearer phase separation: Discovered clusters aligned with known biomechanical phases (e.g., stance vs. swing) without manual labeling.
- More regular transition graphs: The directed graphs exhibited near‑deterministic cycles, mirroring the rhythmic nature of locomotion.
- Robustness across agents: Even in the high‑dimensional Ant environment, the method avoided over‑fragmentation that plagued the baseline.
These findings are summarized in the original arXiv paper, where visualizations show phase diagrams that are both interpretable to engineers and faithful to the underlying dynamics.
Why This Matters for AI Systems and Agents
Understanding latent phase structures unlocks several practical benefits for AI‑driven robotics and simulation platforms:
- Debugging and Safety: Engineers can pinpoint abnormal phase transitions that may indicate policy drift or hardware faults, enabling pre‑emptive safety checks.
- Policy Transfer: By mapping phases between source and target robots, developers can transfer learned behaviors more systematically, reducing the sample complexity of fine‑tuning.
- Reward Shaping: Phase information can be fed back into the learning loop as auxiliary rewards, encouraging smoother gait cycles and energy‑efficient motions.
- Orchestration of Multi‑Agent Systems: In swarm or collaborative robotics, synchronized phase graphs facilitate coordinated maneuvers without explicit communication.
For organizations building AI‑powered automation, these capabilities translate into faster development cycles and more reliable deployments. The ability to visualize and reason about a policy’s internal rhythm aligns with the goals of Enterprise AI platform by UBOS, where transparent model introspection is a core requirement.
What Comes Next
While the framework marks a significant step forward, several open challenges remain:
- Real‑World Transfer: Extending the method from simulation to physical robots will require handling sensor noise and latency.
- Scalability to High‑Frequency Data: As policies operate at kilohertz rates, efficient incremental clustering becomes essential.
- Integration with Model‑Based Controllers: Combining learned phase graphs with classical control loops could yield hybrid systems that inherit the best of both worlds.
- User‑Friendly Tooling: Packaging the pipeline into a plug‑and‑play library would lower the barrier for robotics teams.
Future research may explore graph‑neural networks that directly consume the phase transition graph as a supervisory signal, or reinforcement‑learning curricula that explicitly reward the emergence of clean phase cycles. Companies interested in rapid prototyping can experiment with the Workflow automation studio to stitch together data collection, clustering, and visualization steps without writing extensive glue code.
Conclusion
The study delivers a practical, data‑driven method for visualizing latent locomotion phases in deep reinforcement‑learning policies. By augmenting clustering features with temporal context and introducing a self‑transition‑aware cluster count estimator, the authors achieve clearer, more regular phase diagrams across diverse MuJoCo benchmarks. This advancement equips robotics researchers and AI engineers with a diagnostic lens that bridges the gap between black‑box policies and interpretable gait cycles, paving the way for safer, more transferable, and more efficient locomotion agents.
References
- Yasui, D., Matuki, T., & Sato, H. (2026). Visualizing Latent Phase Structures in Locomotion Policies: A Multi‑Environment Study with Temporal Feature Extension. arXiv preprint arXiv:2605.28186v1.
- OpenAI. (2024). Deep Reinforcement Learning for Continuous Control. Retrieved from arXiv.
- MuJoCo Documentation. (2025). Physics Engine for Model‑Based Control. Retrieved from MuJoCo.org.