
- Updated: March 18, 2026
- 3 min read
End‑to‑End Tracing for OpenClaw Rating API Token Bucket Rate Limiting
In today’s fast‑moving API economy, developers need visibility into how their rate‑limiting mechanisms behave under real‑world load. This guide walks you through instrumenting the OpenClaw Rating API token‑bucket limiter with OpenTelemetry (or any compatible tracing library), complete with sample code, a visual trace dashboard, and best‑practice advice on how tracing complements existing metrics, alerting, and security hardening guides.
Why Trace Token‑Bucket Rate Limiting?
Metrics tell you what happened – request counts, latency percentiles, bucket fill levels. Traces tell you why it happened – the exact path a request took, where it waited, and which service applied the limit. Together they give a full picture for debugging, performance tuning, and security audits.
Setup OpenTelemetry
First, add the OpenTelemetry SDK to your OpenClaw service:
npm install @opentelemetry/api @opentelemetry/sdk-node @opentelemetry/instrumentation-httpInitialize the tracer:
const { NodeTracerProvider } = require('@opentelemetry/sdk-node');
const { SimpleSpanProcessor } = require('@opentelemetry/sdk-trace-base');
const { ConsoleSpanExporter } = require('@opentelemetry/sdk-trace-base');

const provider = new NodeTracerProvider();
provider.addSpanProcessor(new SimpleSpanProcessor(new ConsoleSpanExporter()));
provider.register();

const tracer = provider.getTracer('openclaw-token-bucket');
Instrument the Token‑Bucket Limiter
Wrap the limiter logic in a span so each request’s journey is recorded:
function checkRateLimit(req, res, next) {
  const span = tracer.startSpan('tokenBucket.check', {
    attributes: {
      'http.method': req.method,
      'http.url': req.originalUrl,
      'client.ip': req.ip
    }
  });

  try {
    const allowed = tokenBucket.consume(req.ip);
    span.setAttribute('tokenBucket.allowed', allowed);
    if (!allowed) {
      span.setStatus({ code: 2, message: 'Rate limit exceeded' });
      res.status(429).send('Too Many Requests');
      return;
    }
    next();
  } finally {
    span.end();
  }
}
Visualize Traces
Send spans to a backend such as Jaeger, Zipkin, or Grafana Tempo. In Grafana, create a dashboard that shows:
- Rate‑limit violations per minute.
- Average latency of allowed vs. blocked requests.
- Top client IPs hitting the limit.
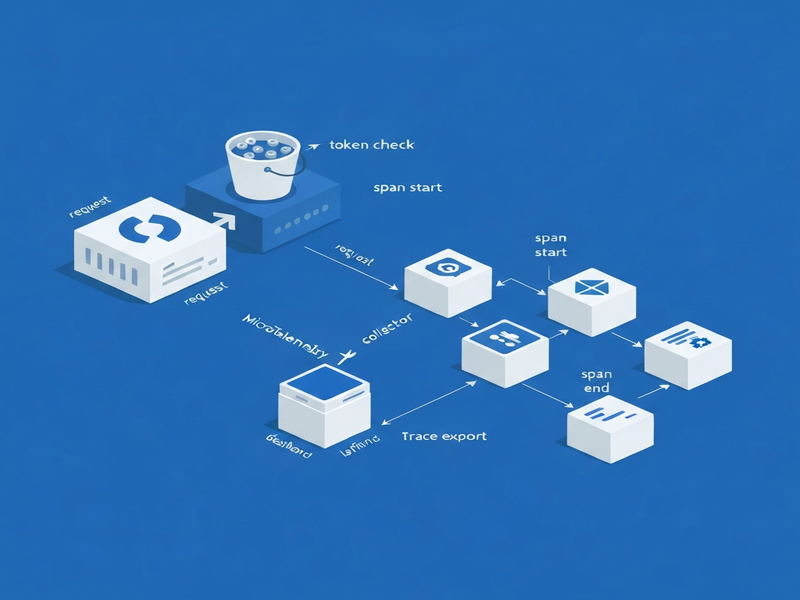
Below is a diagram of the tracing flow:
How Tracing Complements Existing Observability
Metrics give you thresholds for alerts (e.g., >100 rate‑limit hits/min). Traces let you drill down into the offending requests, see which downstream services were called, and verify that security policies (like IP blacklists) are applied correctly. This synergy reduces MTTR and helps security teams spot abuse patterns early.
AI‑Agent Hype – A Timely Angle
With the explosion of AI agents consuming APIs at scale, rate‑limiting has become a frontline defense against runaway bots. By pairing token‑bucket limits with rich tracing, you can differentiate legitimate AI‑driven traffic from malicious scraping, and even feed trace data into automated policy engines that adapt limits in real time.
Next Steps
- Deploy the OpenTelemetry collector alongside your OpenClaw service.
- Configure alerting on the “tokenBucket.allowed = false” attribute.
- Integrate trace data with your security hardening guide for continuous compliance.
For a deeper dive into OpenClaw deployment, see our hosting guide.